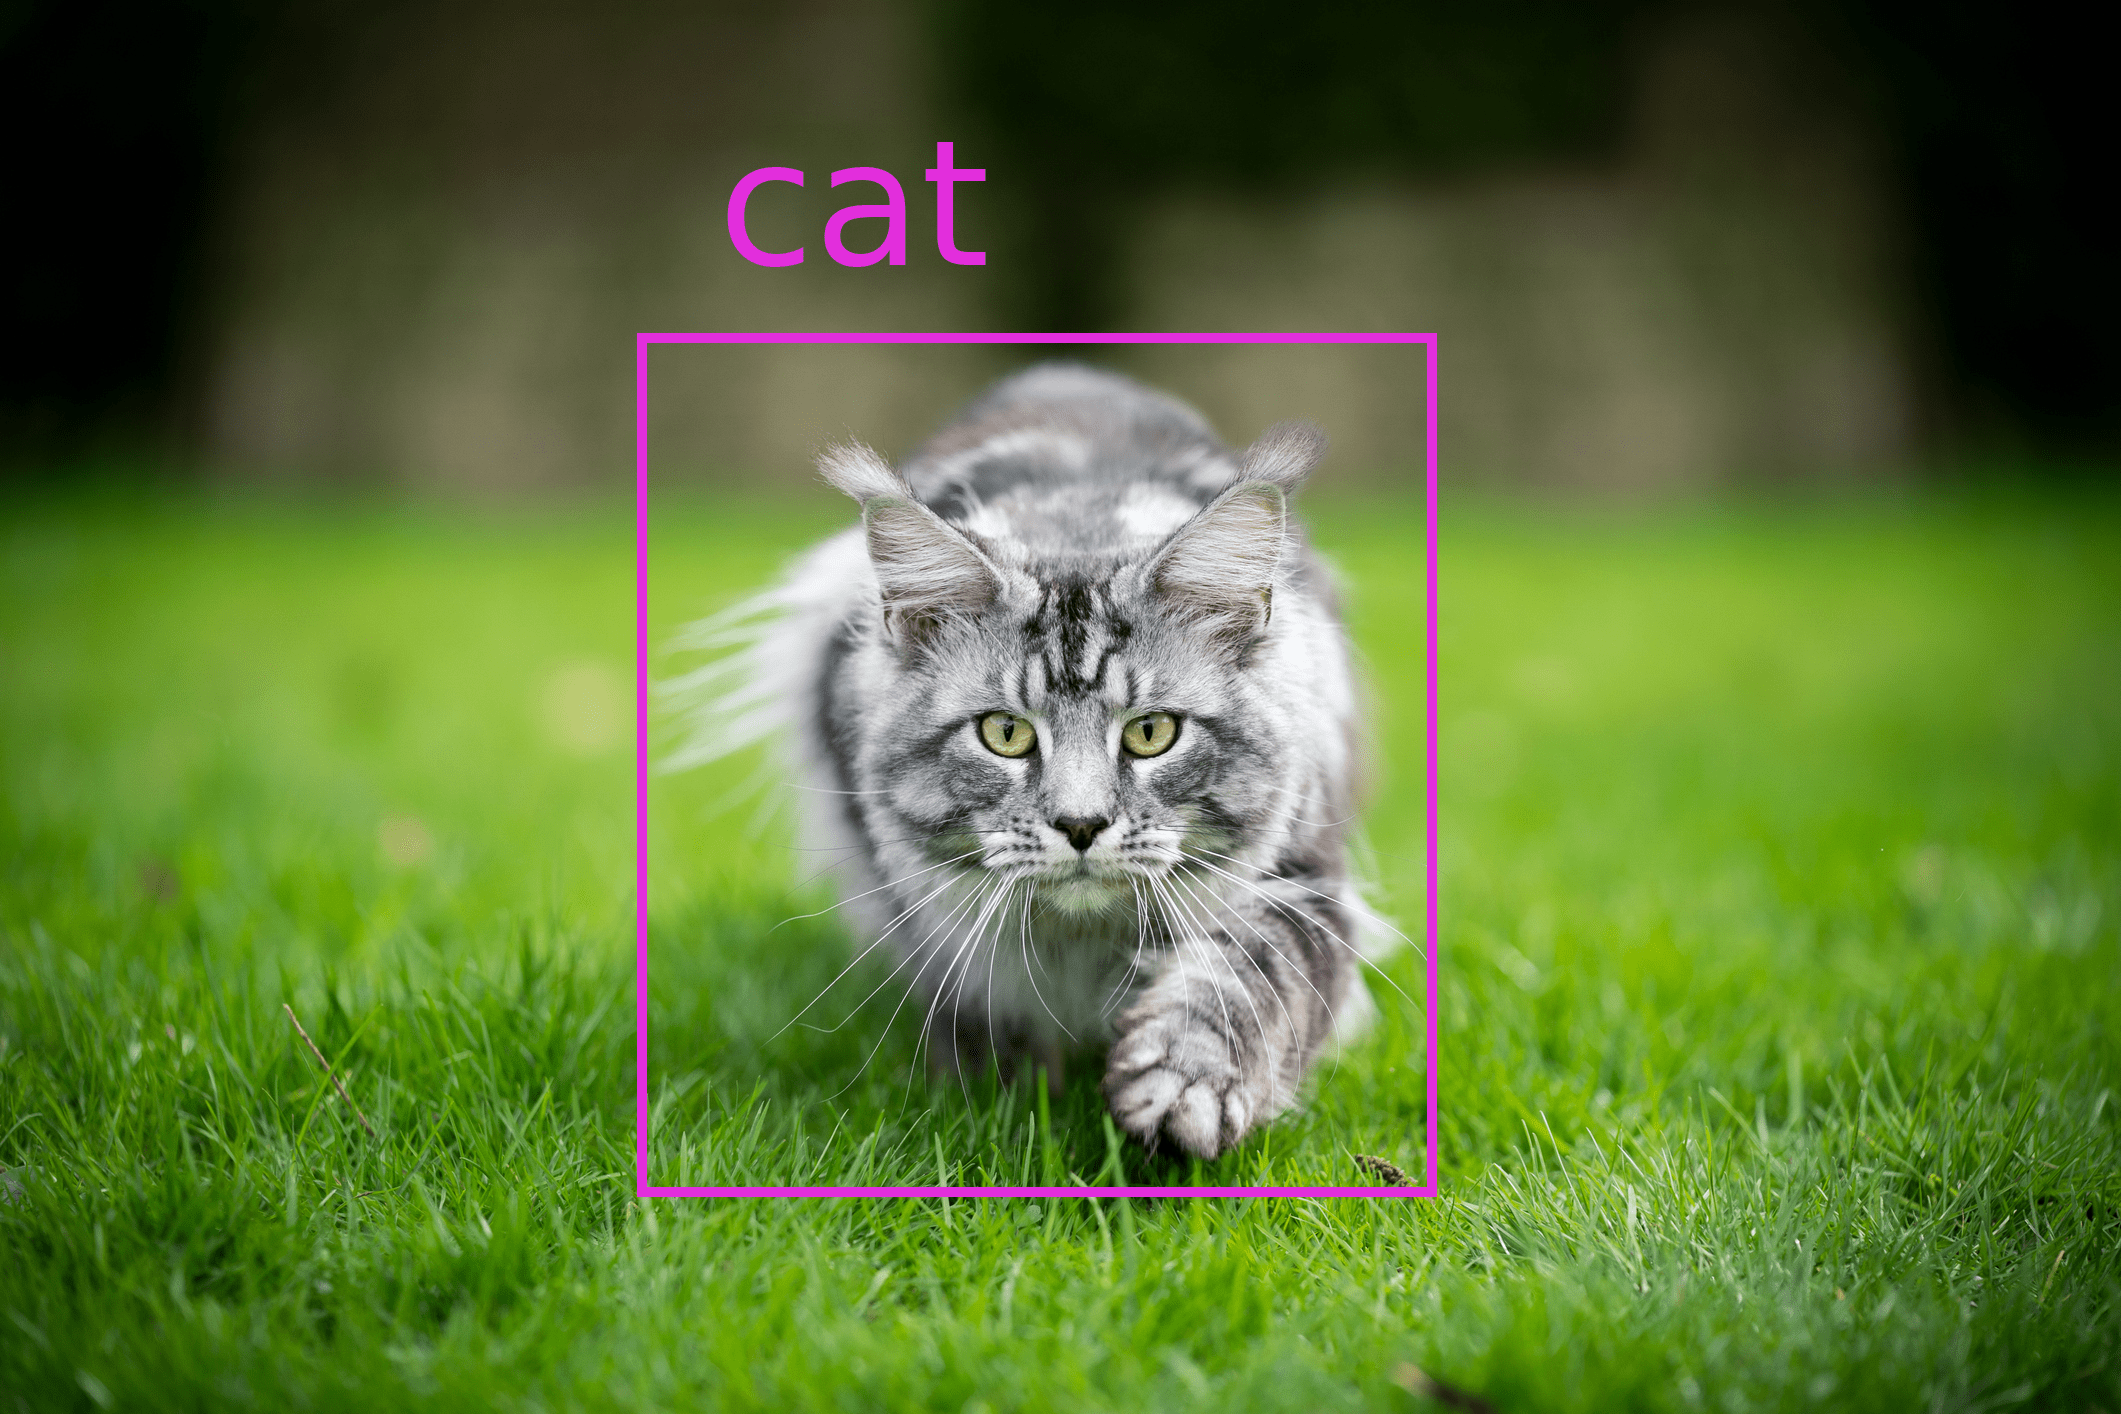
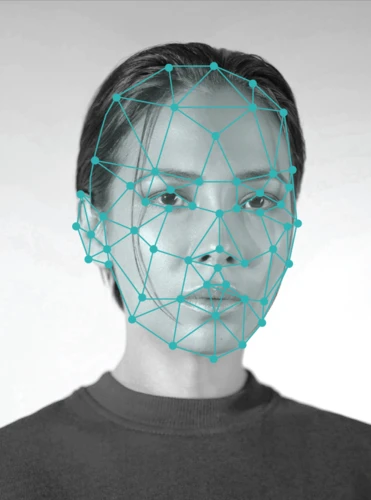
We develop custom computer vision solutions, actively participate in computer vision research and regularly publish technical content about related aspects.
Talk with Sr. Machine Learning Scientist Mark Bugden (PhD) about your computer vision projects.
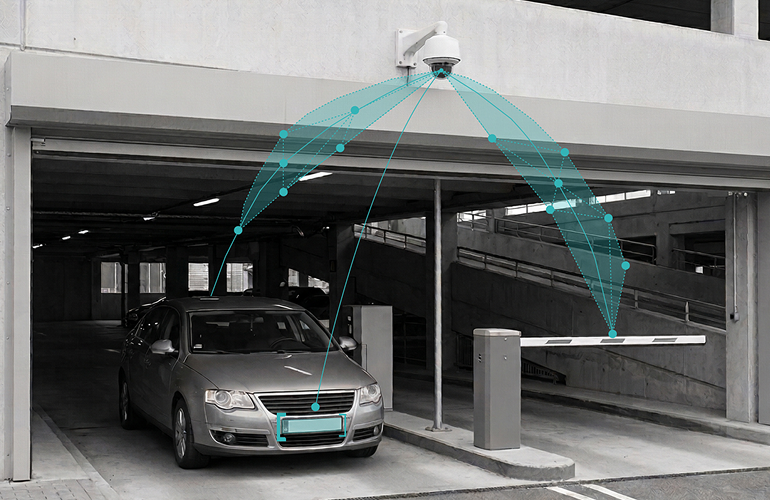
Building a real time license plate matching service
Fabian Dechent
May 23rd, 2025
This talk covers strategies applied in bringing a real-time license plate matching service into production. Based on the project requirements, we discuss the chosen ML model architecture and training procedure, implemented software architecture components, as well as tools and infrastructure for the deployment. Particular focus will be on the deployed microservices architecture and model serving using NVIDIA Triton.
dida talks
Ma Li (PhD)
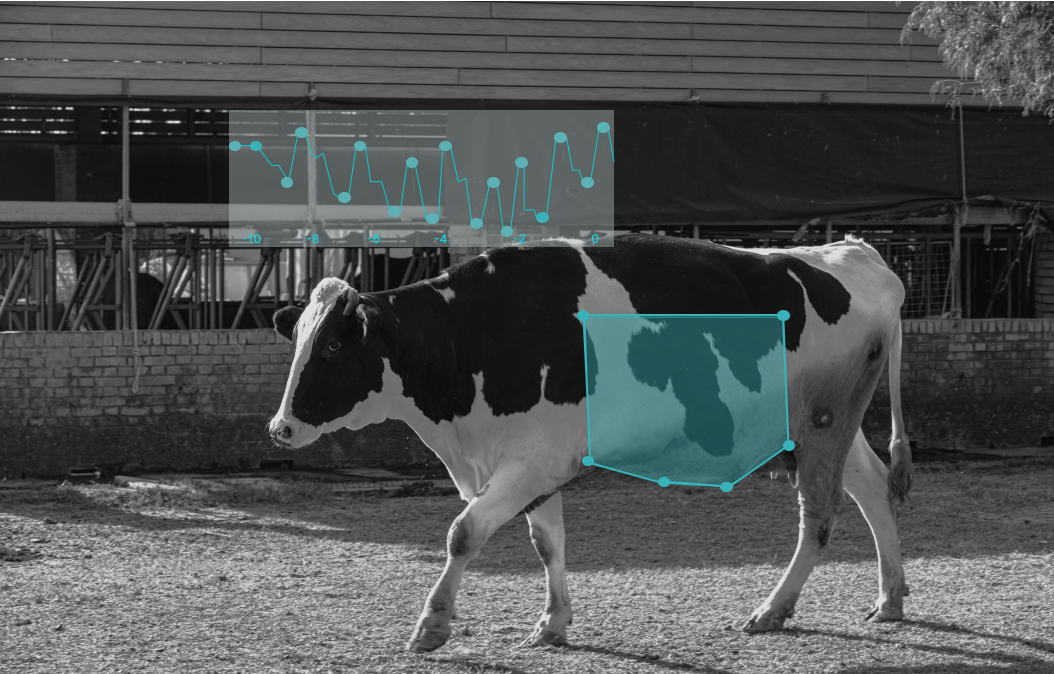
Detecting subtle events in videos with YOLO-in-time
Ma Li (PhD)
May 23rd, 2025
In this talk, we present a general-purpose model architecture that is suitable for detecting and counting subtle events in videos. It combines a convolutional neural network (CNN), a recurrent neural network (RNN) and a YOLO-type head in the time domain. The model can be trained end-to-end with time-resolved labels only, without the need for customization or domain-specific knowledge. We discuss possible use cases and show experimental results both on synthetic datasets and on real world datasets.
dida talks
Jan Macdonald (PhD)
Pretraining AI models for earth observation: transfer-learning and meta-learning
Jan Macdonald (PhD)
May 31st, 2024
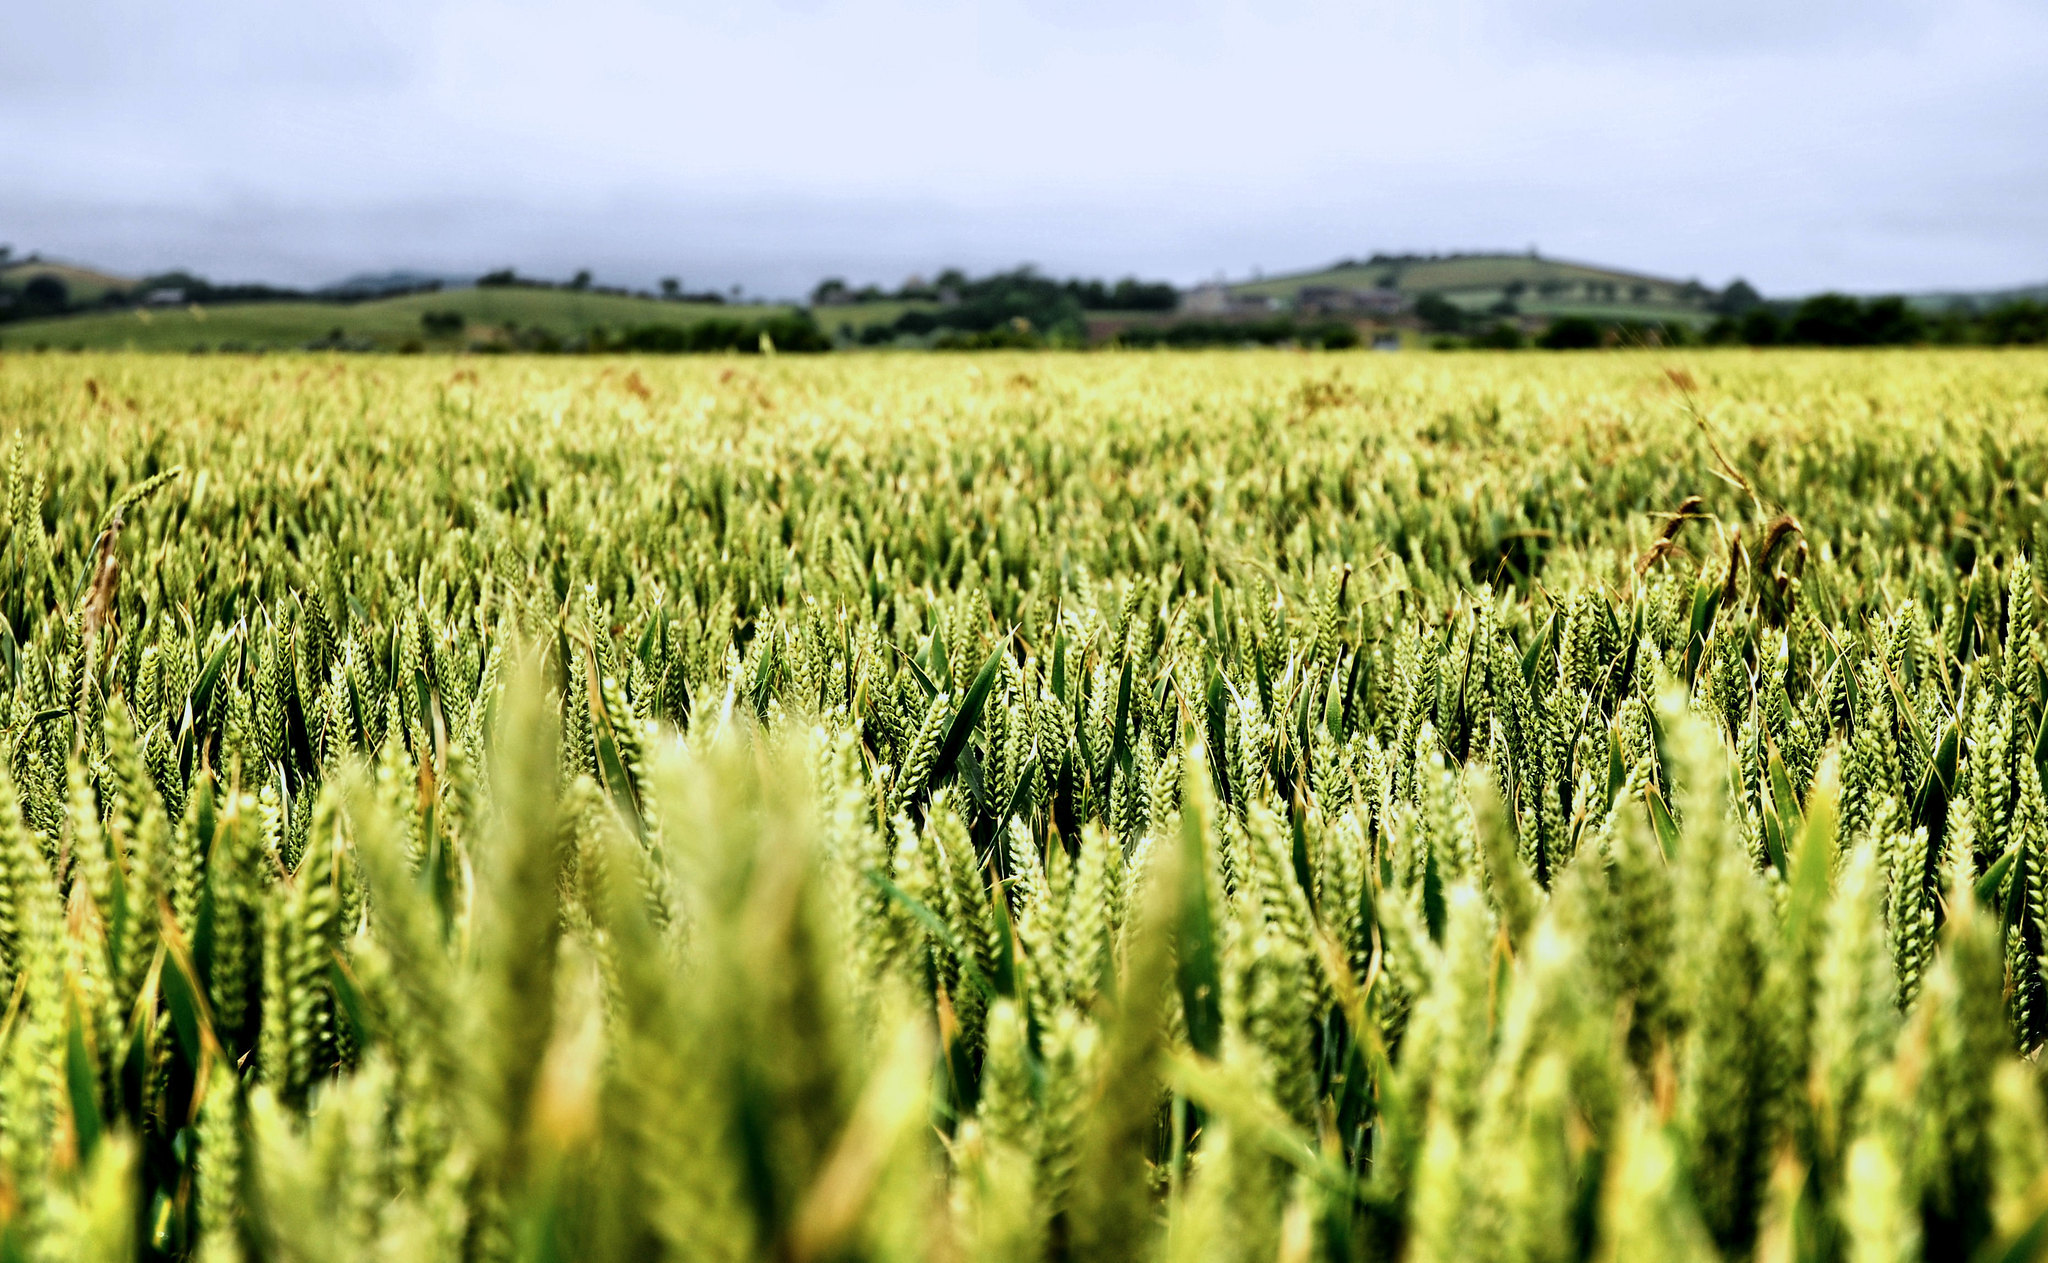
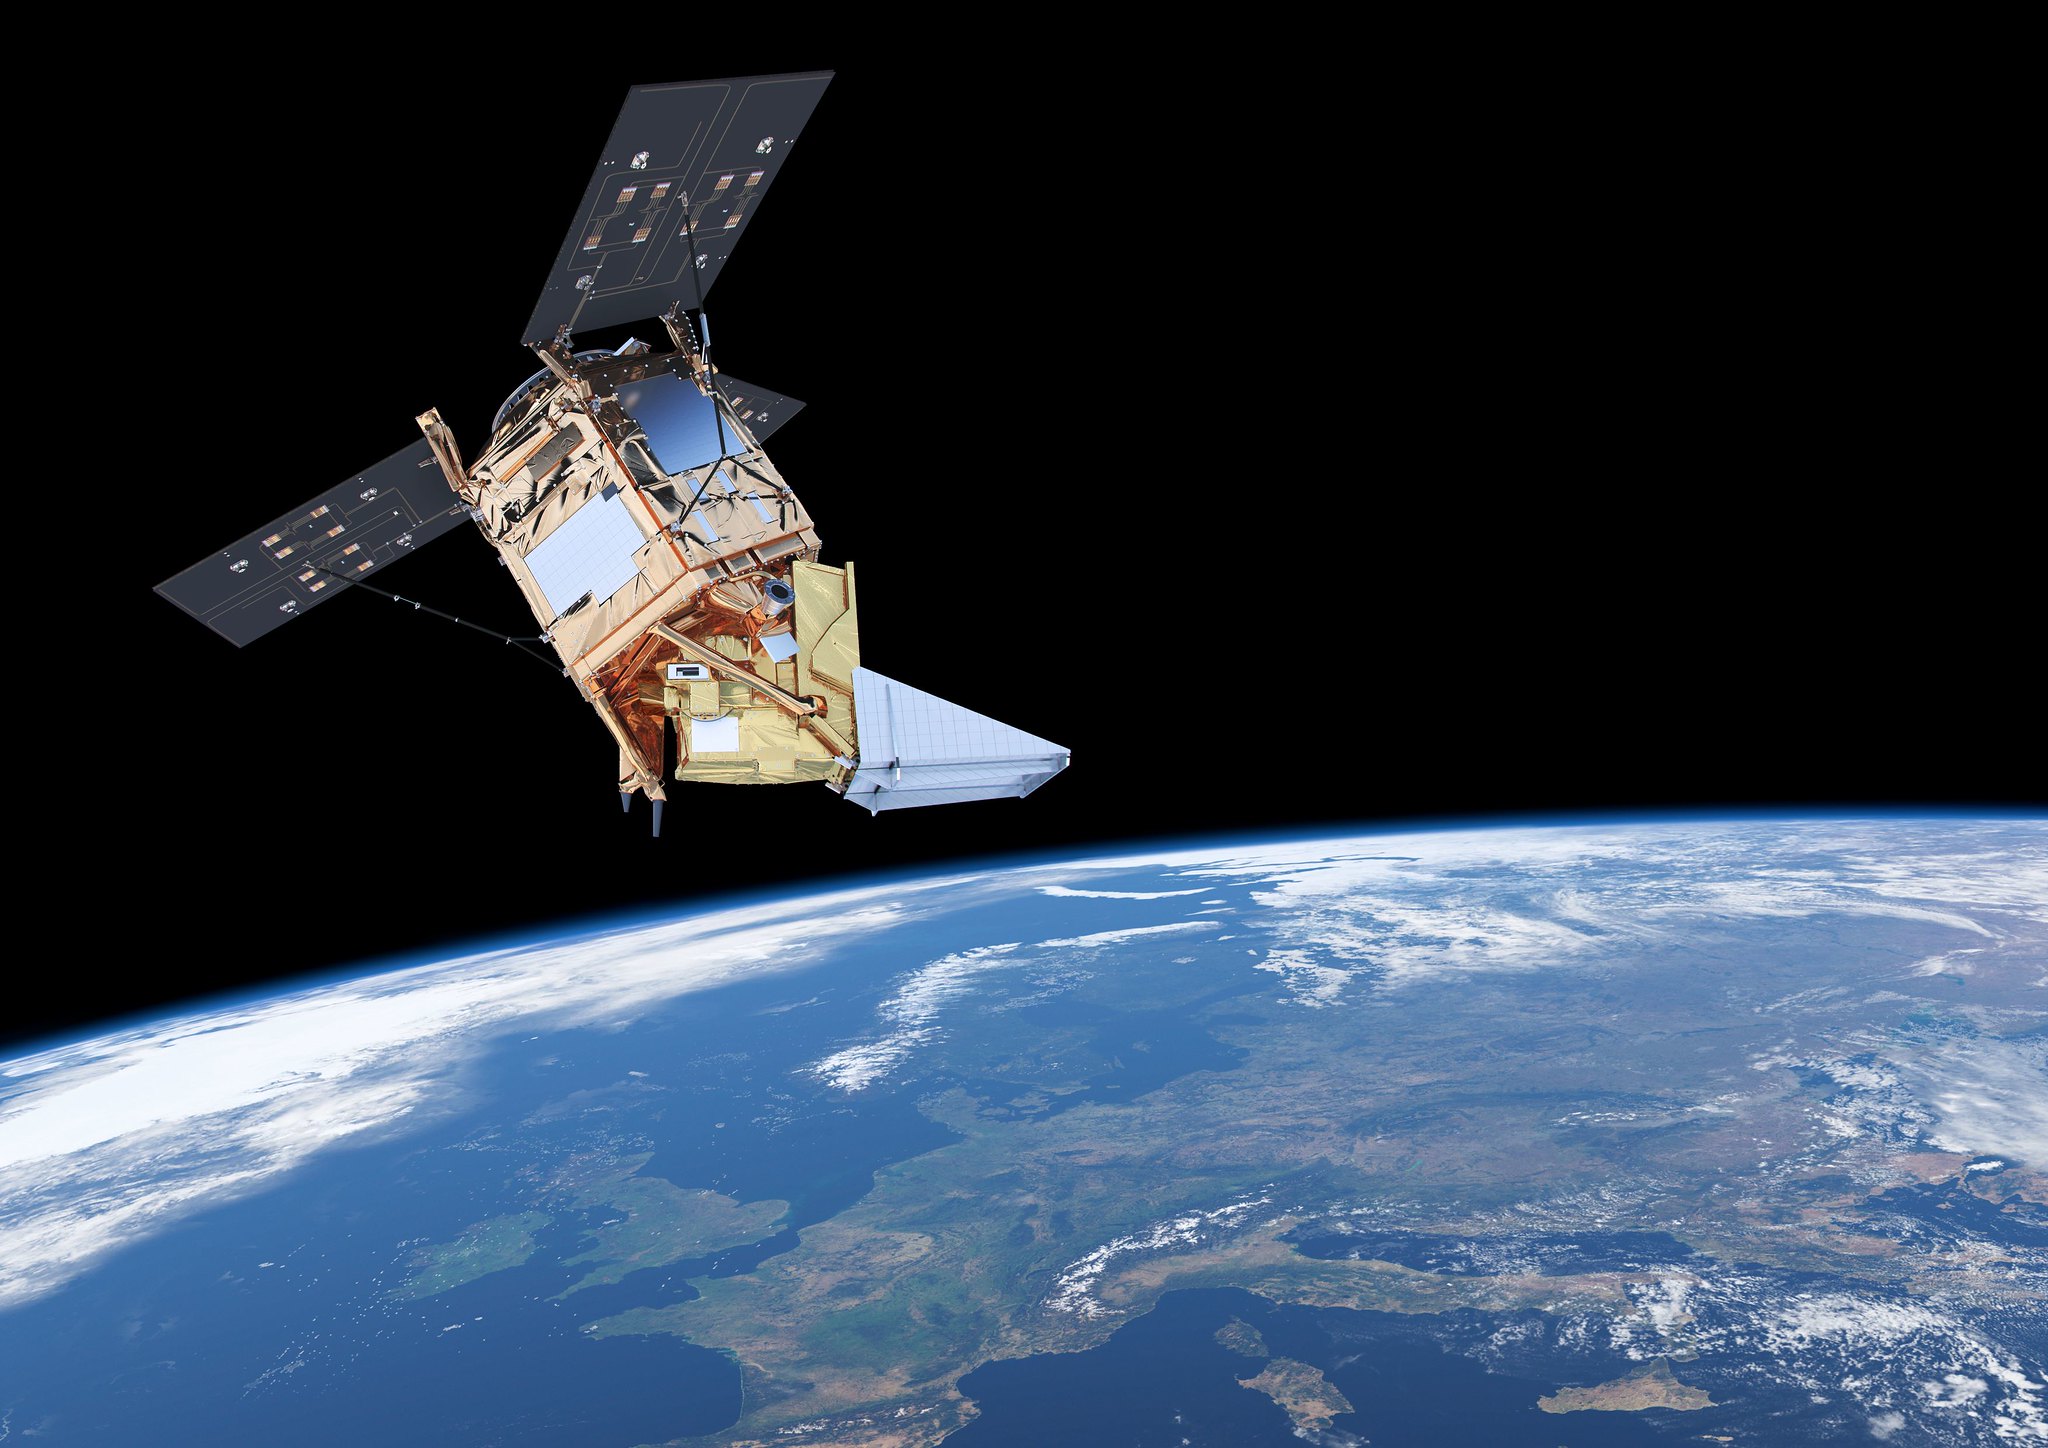
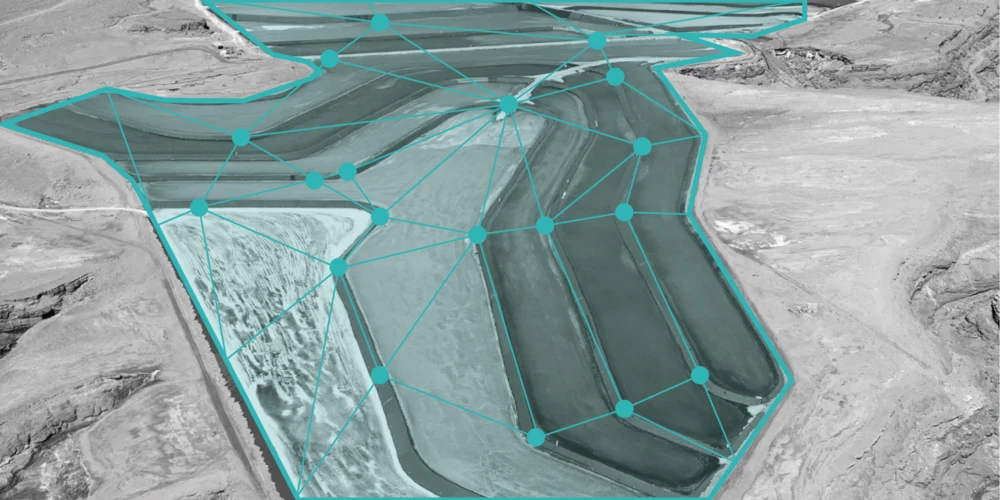
Pretraining involves training an AI model on a large dataset to learn general features, which can then be finetuned on specific tasks with smaller datasets. This decreases the need for time intensive dataset acquisition and training efforts for each new use case, reducing the costs of application development. While pretrained models are widely used in computer vision and natural language processing, their adoption for satellite data and earth observation applications remains limited. Our investigation focuses on comparing the capabilities of transfer-learning and meta-learning approaches for the pretraining of AI models in earth observation tasks, particularly crop type classification, and their potential to generalize insights across different geographical regions.
dida talks
Maximilian Trescher (PhD)
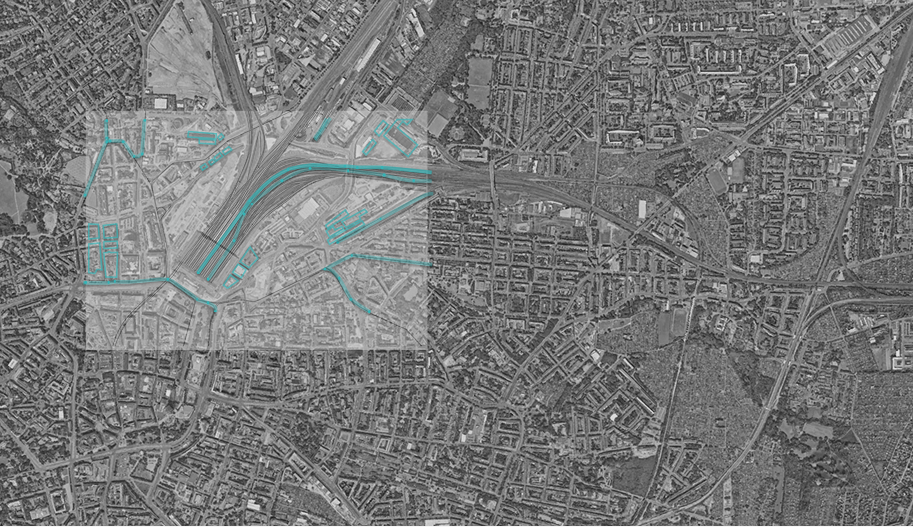
Anomaly detection in track scenes
Maximilian Trescher (PhD)
May 31st, 2024
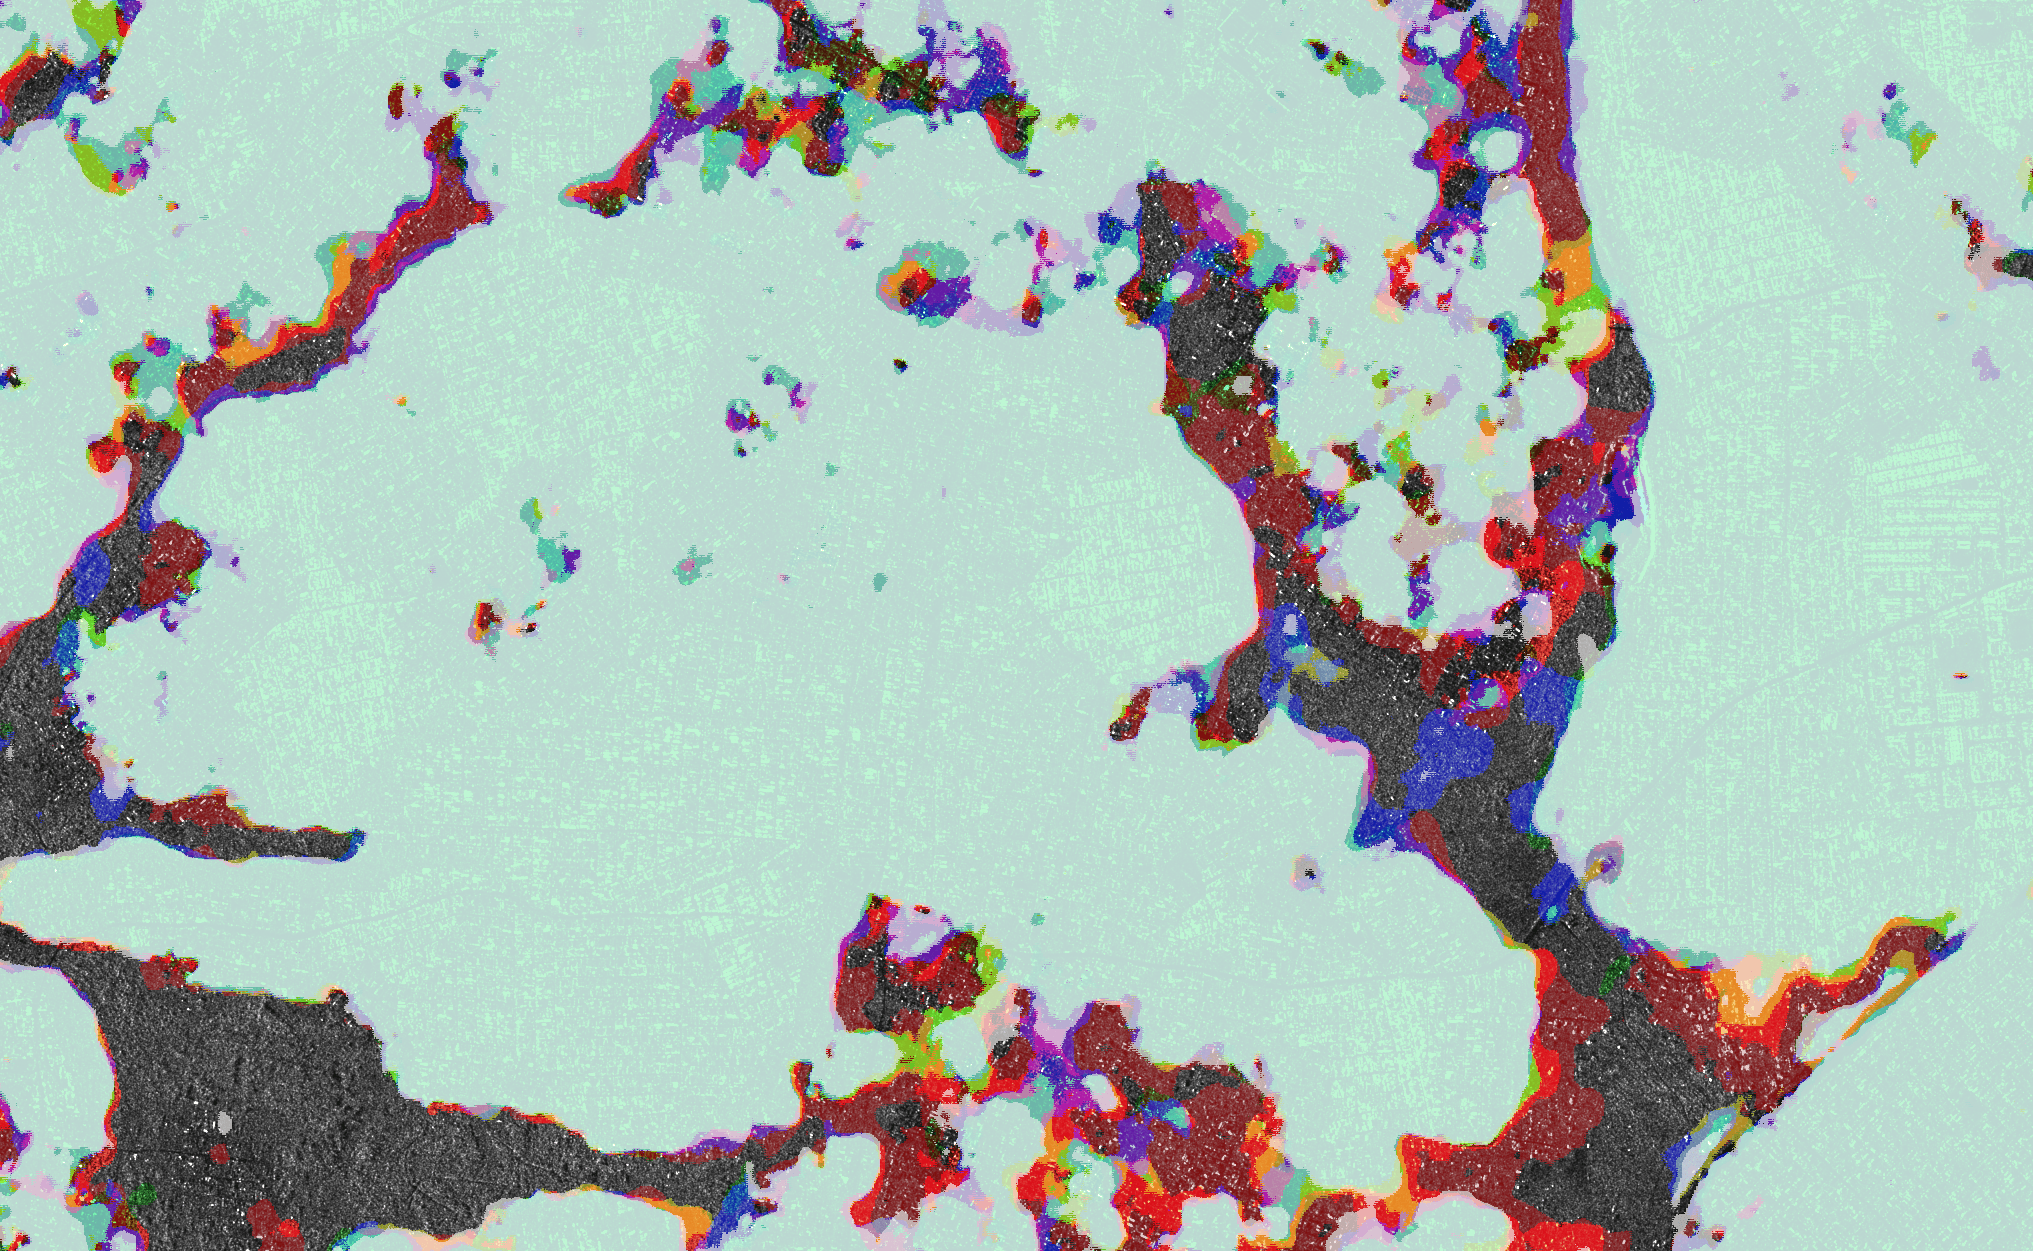
Within the sector initiative “Digitale Schiene Deutschland”, our client Deutsche Bahn is developing an automated driving system for trains. As a part of the efforts towards such a system we developed, together with Deutsche Bahn, a machine learning solution to detect anomalous and hazardous objects on and around the tracks using onboard RGB cameras. It is intentionally required that this system does not simply detect objects within a given collection of classes (such as people, signals or vehicles), but rather has the ability to detect any object and rank them by how anomalous they are. This presentation explains the challenges encountered, presents several approaches explored, and provides an overview of the final solution: In order to detect objects of possibly unkown classes we developed a unique pipeline containing multiple machine learning components, including a monocular depth estimation model, a segmentation stage, image embedding models and an anomaly detection model. As dataset, Digitale Schiene Deutschland provides us with OSDAR23, an open dataset that contains 45 scenes. Each scene contains images taken by several RGB cameras and infrared cameras, together with radar and lidar data. This dataset contains annotations for twenty classes of objects, which we use both for finetuning our model and for evaluating the final results. Besides, we were also granted access to a larger amount of unannotated data, which were used for self-supervised learning.
dida talks
William Clemens (PhD)
Detecting Convective Clouds in Geostationary Satellite
William Clemens (PhD)
February 26th, 2020
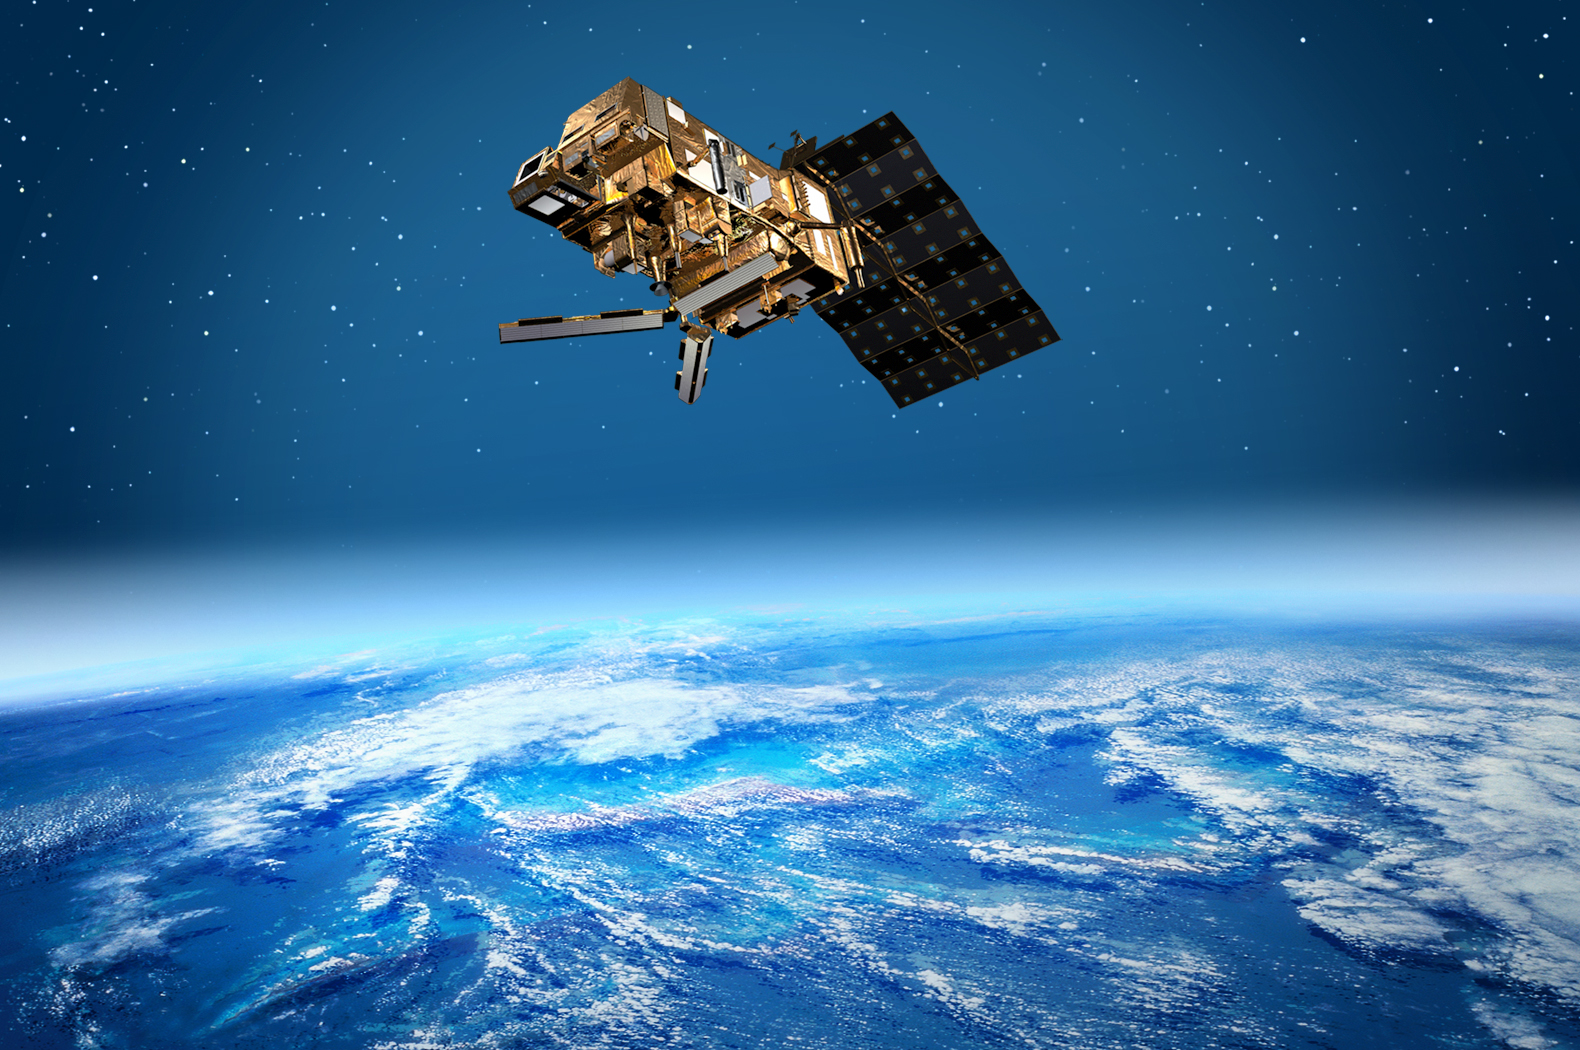
Detecting convective clouds is crucial for weather forecasting and climate studies. In his work, William Clemens (PhD), a Machine Learning Scientist at dida, leverages Convolutional Neural Networks (CNNs) to analyze geostationary satellite data for this purpose. CNNs are particularly adept at image recognition tasks, making them suitable for identifying the complex patterns and structures characteristic of convective clouds. Clemens's approach likely involves training the CNNs on large datasets of satellite imagery labeled with the presence of convective clouds, enabling the model to learn the distinguishing features of these clouds.
dida talks
William Clemens (PhD)
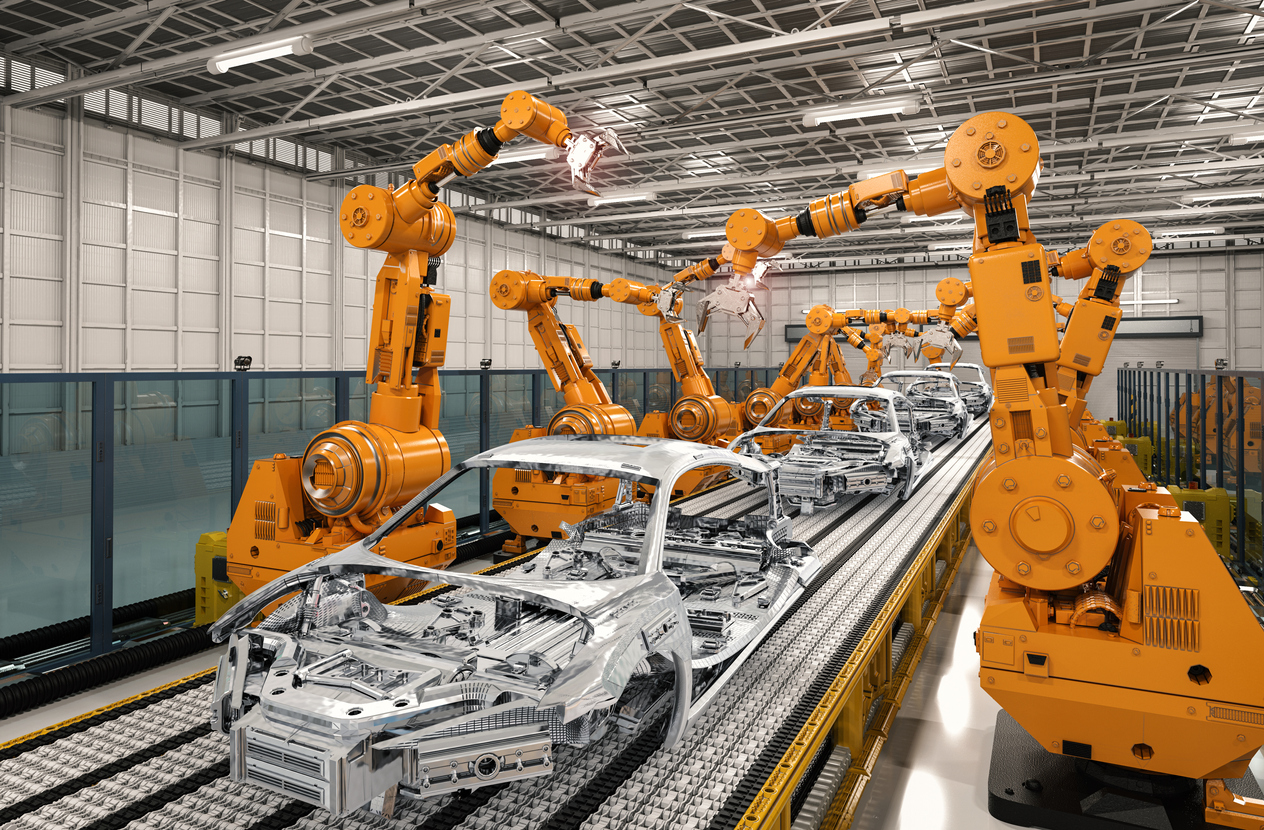
LaserSKI: Object Detection for Defect Detection in Semiconductors
William Clemens (PhD)
May 11th, 2022
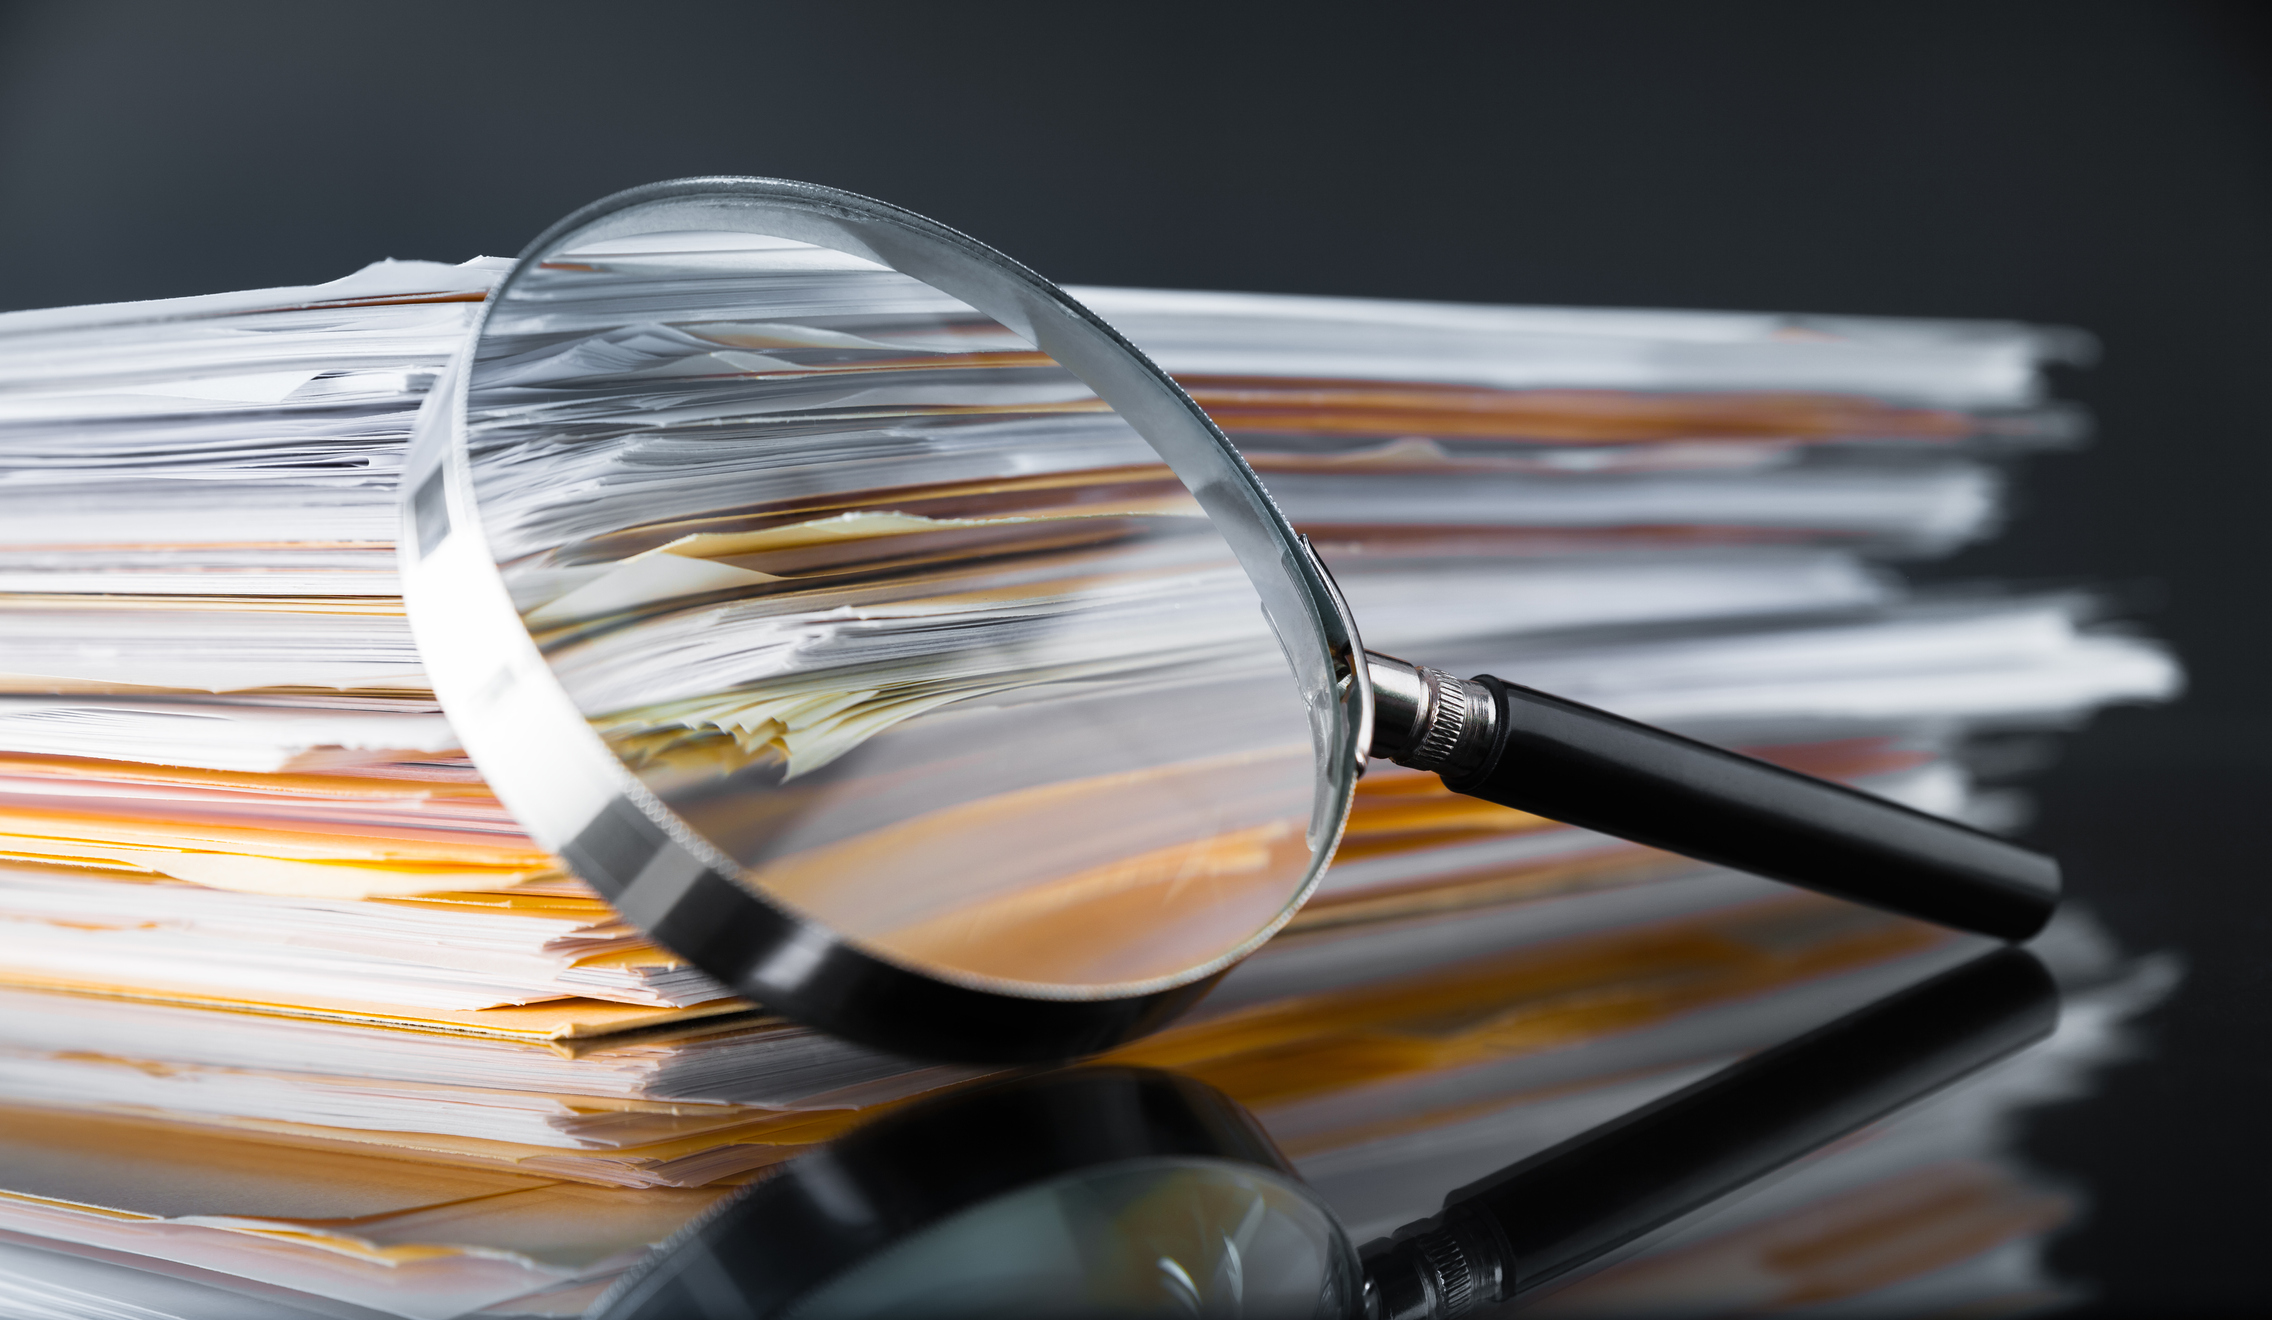
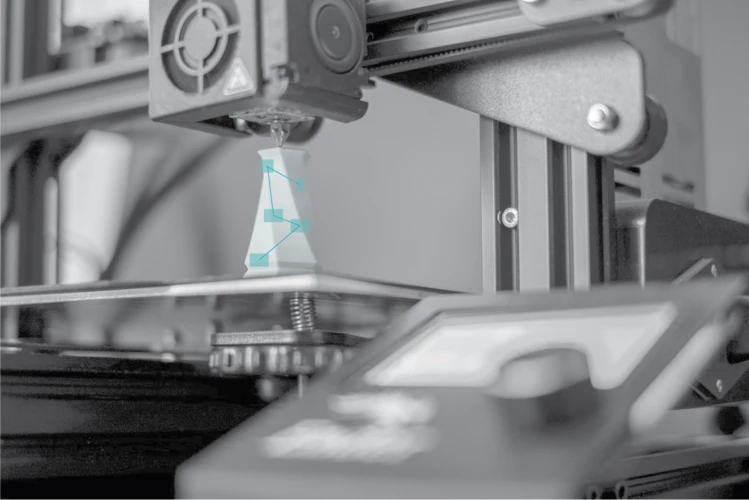
In this talk, William Clemens (PhD) presented our work about detecting defects in manufacturing processes of semiconductors. By utilizing convolutional neural networks, the system inspects images of semiconductors to identify and classify defects, enhancing the efficiency and reliability of quality control, with the goal of reducing monotonous manual inspections. LaserSKI was a joint project of three industrial manufacturers of laser diodes as well as the Ferdinand-Braun-Institut and Leibniz-Institut für Höchstfrequenztechnik (FBH). The talk was given at the Applied Machine Learning Days (AMLD) 2022.
dida talks
Moritz Besser
Jona Welsch
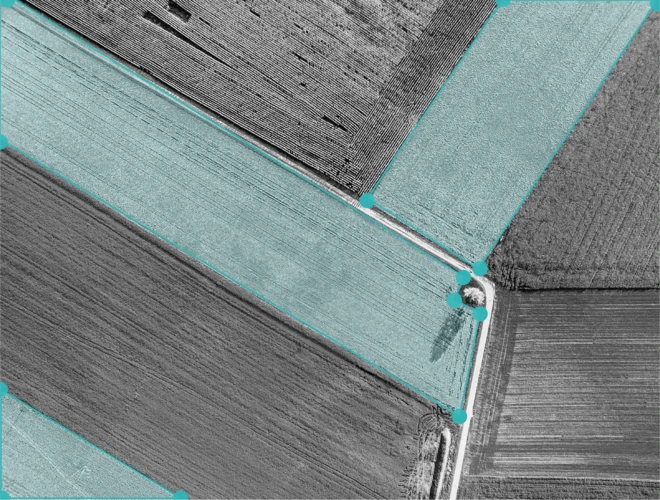
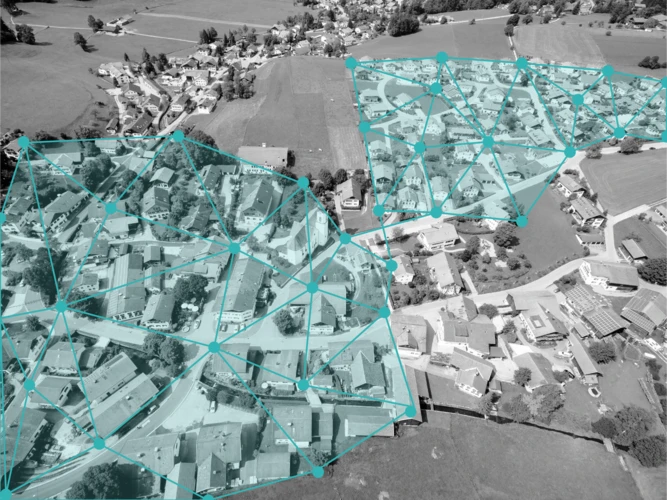
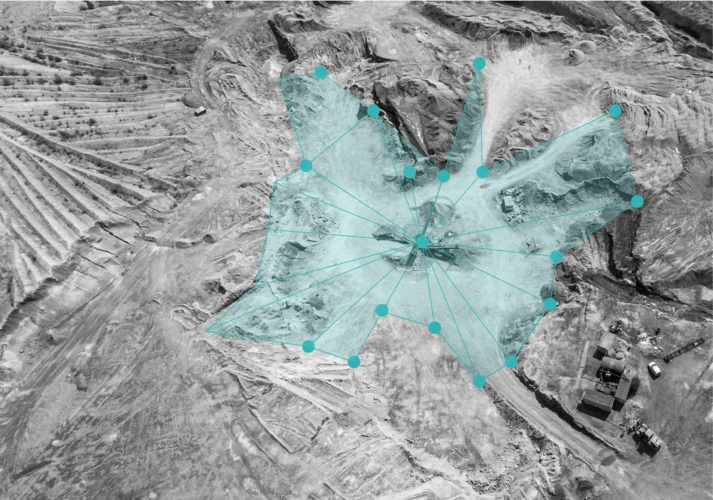
ML for Remote Sensing: Analyse satellite data automatically
Moritz Besser and
Jona Welsch
December 6th, 2021
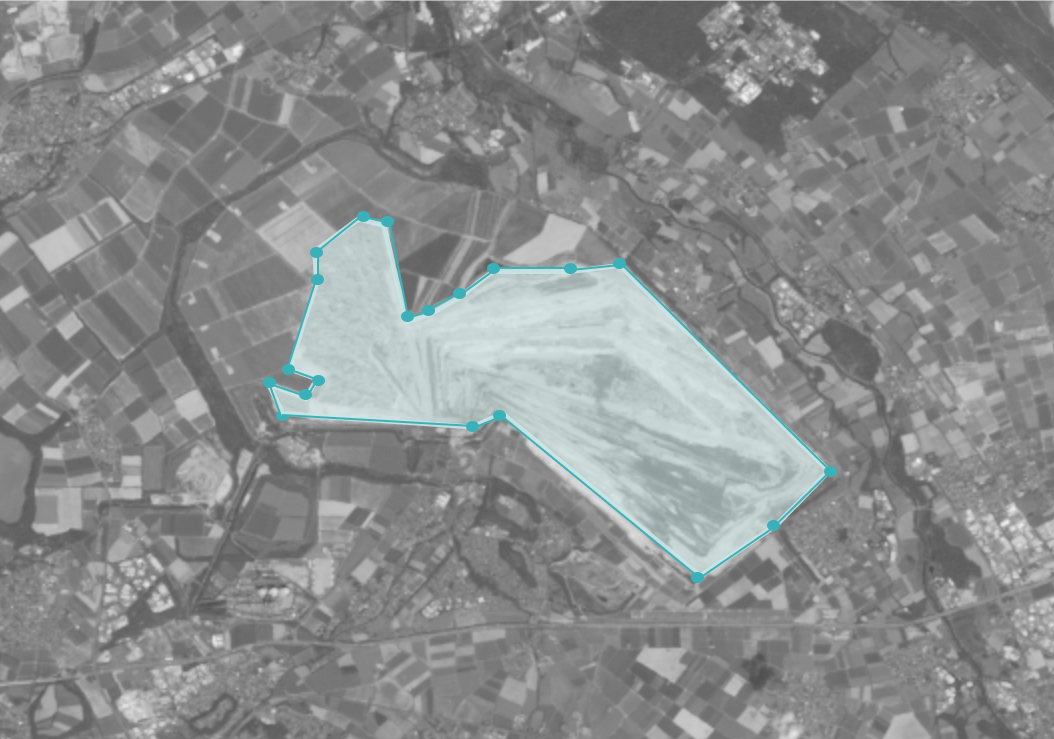
The availability of Remote Sensing data and especially satellite data has seen a strong increase in the last years. With increasing data volumes, manual evaluation of these data becomes less efficient. Machine Learning methods are predestined to bridge this gap between data availability and need for evaluation expertise, making it possible for a larger user group to extract information from satellite data and apply this information in an enterprise context. In the upcoming webinar, Moritz Besser (Machine Learning Consultant) and Jona Welsch (Machine Learning Project Lead) will give an overview of the different types of available satellite data, Machine Learning methods used for their evaluation, as well as practical use cases.


.jpg)


.jpg)


.png)