

Artisanal and Small Mine Detection
See how we developed a machine learning software to stop environmental destruction through illegal mines, based on satellite data and object detection.
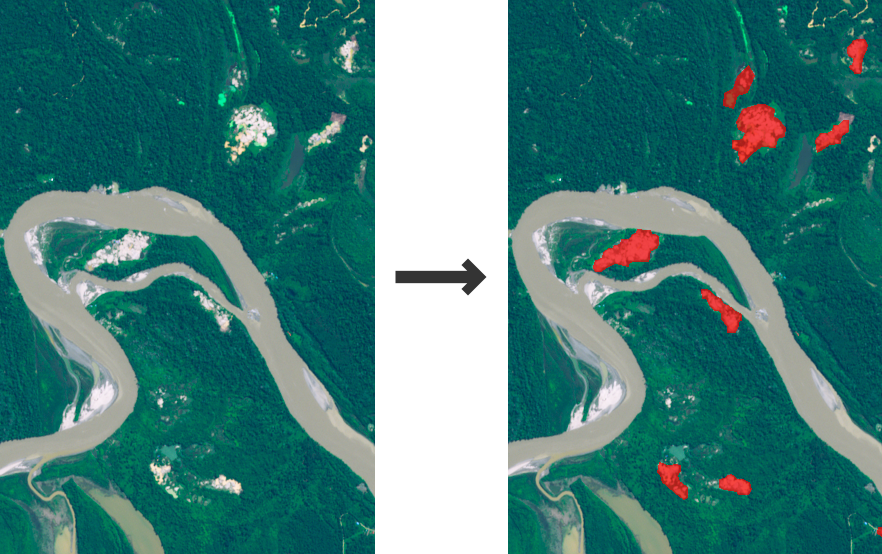
Input
Satellite images
Output
Location and extent of gold mines
Goal
Provide timely information on artisanal gold mining
Introduction
Starting Point
Challenges