Automated Detection and Analysis of Tailings
Using various satellite images, a suite of computer vision models and mathematical modeling is applied to detect, segment and analyze tailings with respect to their volume and mineralogical content.
Input
Satellite Images from multi- and hyper-spectral satellites, as well as digital elevation models
Output
Detection and classification of the tailing, its volume and its elemental constituent concentrations
Goal
Discover resource-rich tailings for potential reprocessing with enhanced methods
Introduction
Labelling Process

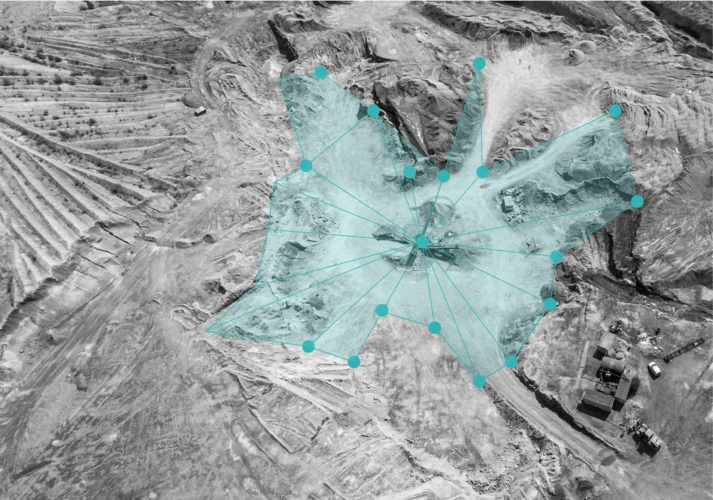
Semantic Segmentation


Volume Estimation


Mineral Signature Extraction