An image segmentation algorithm that supports sustainable city planning.
Input: | Satellite radar data |
Output: | Horizontal expansion and vertical change of a city |
Goal: | Monitoring urban growth at low cost and at regular intervals |
Urban planning in rapidly growing cities is a challenging task, especially when resources are scarce. In Lagos (Nigeria), Accra (Ghana), and Luanda (Angola), for which our solution was created, slum formation is a major urban planning issue as more and more people settle down in the periphery of these cities. In these areas, no basic infrastructure such as water, electricity, or public schools is present. This is why urban planners want to be able to monitor the growth of suburban areas.
Using the example of three metropolises in West Africa, dida investigated which solution for monitoring urban growth (horizontal expansion and change) and urban density (vertical change) is technically feasible on the basis of satellite data and machine learning algorithms to support urban planning.
Urban planners need very detailed information on a vertical and horizontal scale of individual houses. However, no current satellite imagery provides the required spatial resolution at reasonable costs. Because of this, urban planners in developing countries work largely with Google or Bing Maps that provide high-resolution data, but in irregular intervals. Additionally, drones and LIDAR flights with high-resolution imagery (10-30 centimeters) are conducted, but due to budgetary constraints, this can only be done every two to ten years.
Optical satellite data has the disadvantage that cloud cover prevents high interval observations, especially in tropical regions like the cities selected for this project (Accra, Lagos, Luanda).
Satellite elevation data is difficult to obtain at low cost and in high time intervals. TanDEM-X, ASTER, and SRTM data are among the options to consider.
We had access to high-resolution satellite data such as RapidEye (5 meters/pixel), TerraSAR-x (3 meters), and TanDEM-X data (12 meters). We built two separate Machine Learning models; both rely on TerraSAR-X data as input. However, the target data consist of...
binary labels created from RapidEye data for the horizontal segmentation
TanDEM-X data as target data for the vertical spread, respectively.
The goal was to train a model that can predict the built-up or horizontal expansion of an urban area and to predict vertical elevation based on a measured DEM (digital elevation model) data set.
For horizontal spread, we reached high accuracy and could create very precise maps that display the expansion of urban areas over time. Determining vertical elevation, however, was more prone to error and noise due to the relatively low resolution. With higher resolution satellite data at a low cost, it might become feasible in the coming years.
Horizontal building footprints for different parts of Lagos (Nigeria):
Vertical elevation maps of Lagos:
Urban planning authorities employ a number of GIS experts experienced working with GIS software such as ArcGIS. For long-term infrastructure planning, very high resolution is required at the building level. For this reason, drone or LIDAR images from flights are purchased. Since flights are very cost-intensive, these flights are carried out every two to ten years, depending on the available financial resources. This is insufficient due to the growth dynamics of these cities.
Satellite data is, although providing a lower spatial resolution, complimentary due to the higher update frequency. In practice, Bing and Google Maps are often used. However, the time interval of these images differs as e.g. Google Maps stitches together cloud-free images when available. Moreover, for countries outside of Northern America and Europe, the update frequency is rather low, resulting in less recent imagery for African cities.
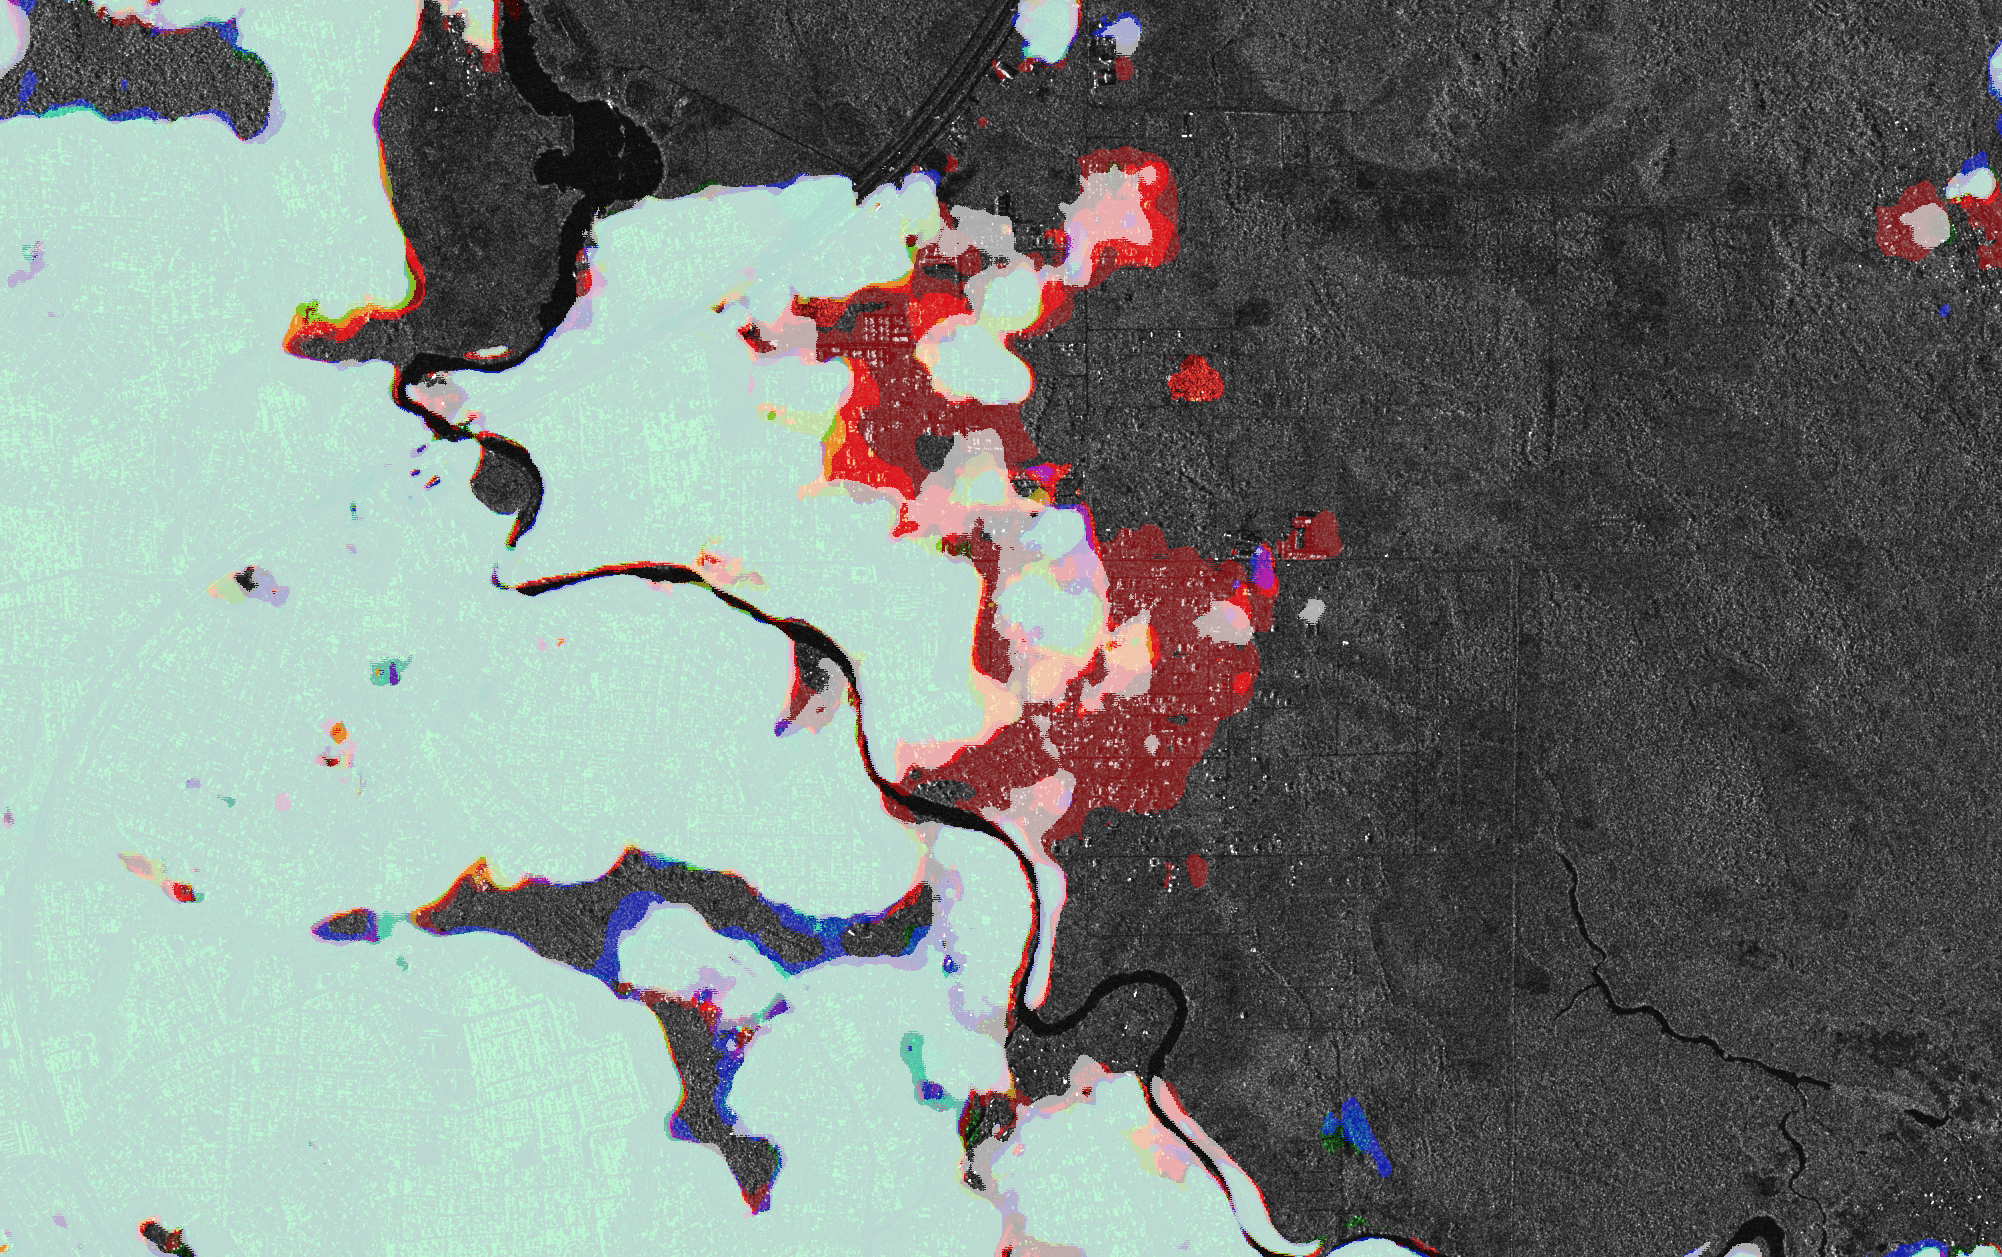
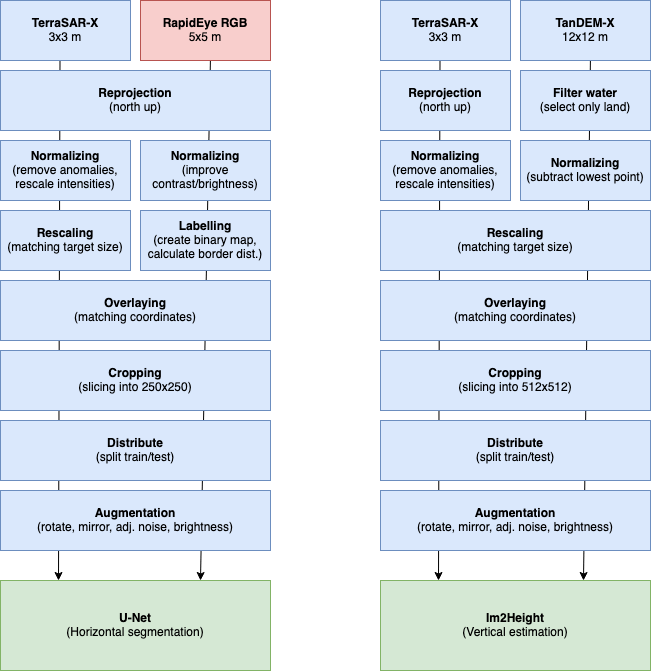
As optical and elevation data have their respective downsides concerning cloud cover and update intervals, we decided to build a solution based on radar data with the highest time and spatial resolution possible. Research indicated that urban planners primarily work with very high-resolution data such as drone imagery and currently conduct their analysis of expanding urban areas approximately once a year or every two years. We decided that higher spatial resolution was preferred over time frequency. There were two options: TerraSAR-X StripMap or Sentinel-1. As TerraSAR-X provided a higher resolution, we chose it as the primary data source for both tasks.
All satellite data were then preprocessed to prepare for feeding into a Machine Learning model.
TerraSAR-X data was used as the input for the Deep Learning models; RapidEye (for horizontal expansion) and TanDEM-X (for digital elevation) were used as labels or ground truth for the Machine Learning models. For the horizontal expansion, we used a U-Net network architecture. For the vertical elevation, we selected the relatively novel Im2Height approach.
While we could show that horizontal urban expansion can be predicted quite accurately (F1-score of 0.9 on the training data set and 0.8 on the test set), the outputs of the vertical elevation predictions were quite noisy and prone to errors. The probable reason for this is that the TanDEM-X data is of lower resolution than the resolution of the input data that was used in the original paper by Mou and Zhu (2017).
If you want to dive deeper into the project, please have a look at our blog post about the project!
Backend: Python, PyTorch, PyTorch-Lightning, NumPy, Rasterio
Infrastructure: GCloud (Training), Git, tensorboard
A selection of projects we have done
ML-based detection of nozzle contamination in industrial 3D printing
Our software protects tenants against excessive service charge bills.
We simulate internet traffic and bidding scenarios to predict the reach of advertising campaigns.
ML-based detection of nozzle contamination in industrial 3D printing