
Can we do without labeled data? (Un)supervised ML
It seems to be a common mistake to believe that machine learning is usually an unsupervised task: you have data (without pre-existing labels) that you train e.g. a neural network on for tasks like classification or image segmentation. The truth is that most models in machine learning are supervised, that is, they rely on labeled training data.
But labeling often takes a lot of time and can be very tedious.
In this blog post I want to find out if I am able to perform the same classification task once with labels, once without.
For this task I will use the famous MNIST data set, which contains 60,000 training and 10,000 validation images of handwritten digits, all of them labeled. Every image consists of 28x28 greyscale pixels and contains only one digit, located in the center of the image. To make things easier, I use the CSV version of the data set.
Using unsupervised learning for classification
If you want to train a model to classify data, you usually use labels that indicate for each sample of data to which class it belongs, so that you can learn the typical patterns for each class. Now, if we want to train a classifier without having any labels, we must first find a way to group the training data points into these classes. For this I will use a clustering algorithm. It will group all the training data we have into ten clusters based on the similarity of the data found. One would expect these clusters to correspond to the "real" classes corresponding to the digits 0-9.
I will use the k-means algorithm which is very simple and intuitive. It will just compare the Euclidean distance between all the data points in the [28x28 pixel]-space (this is just the generalization of how we measure distances in three-dimensional space) and group them in ten clusters according to their locations. The intuition behind the algorithm is that if two data points are close to each other in terms of Euclidean distance, then they probably belong to the same class.
First we load some dependencies:
import numpy as np
import pandas as pd
import matplotlib.pyplot as plt
from tqdm import tqdm, tqdm_notebook


mnist_train = np.array(pd.read_csv('data/mnist_train.csv', header=None))
mnist_test = np.array(pd.read_csv('data/mnist_test.csv', header=None))

X_train = mnist_train.T[1:].T
y_train = mnist_train.T[0].T.astype(np.int32)
X_val = mnist_test.T[1:].T
y_val = mnist_test.T[0].T.astype(np.int32)
Then we define the train and validation sets:
mnist_train = np.array(pd.read_csv('data/mnist_train.csv', header=None))
mnist_test = np.array(pd.read_csv('data/mnist_test.csv', header=None))

X_train = mnist_train.T[1:].T
y_train = mnist_train.T[0].T.astype(np.int32)
X_val = mnist_test.T[1:].T
y_val = mnist_test.T[0].T.astype(np.int32)
Next we set up and train the clustering algorithm:
from sklearn.cluster import KMeans


kmeans = KMeans(n_clusters=10, init='random', n_init=64, max_iter=1000000, n_jobs=64)
kmeans.fit(X_train)
We now have found those ten clusters. Let's compute the closest centroids for the images in the validation set:
def euklidean_distance(a, b):
    return np.sqrt(((a - b) ** 2).sum())


groups = [[] for _ in range(10)]

for index, y in enumerate(X_val):
    distances = [euklidean_distance(y, centroid) for centroid in kmeans.cluster_centers_]
    groups[np.argmin(distances)].append(index)
Finally we can have a look at examples from all ten clusters: We see nine random samples for each cluster, and on the right of them the computed cluster centroid.
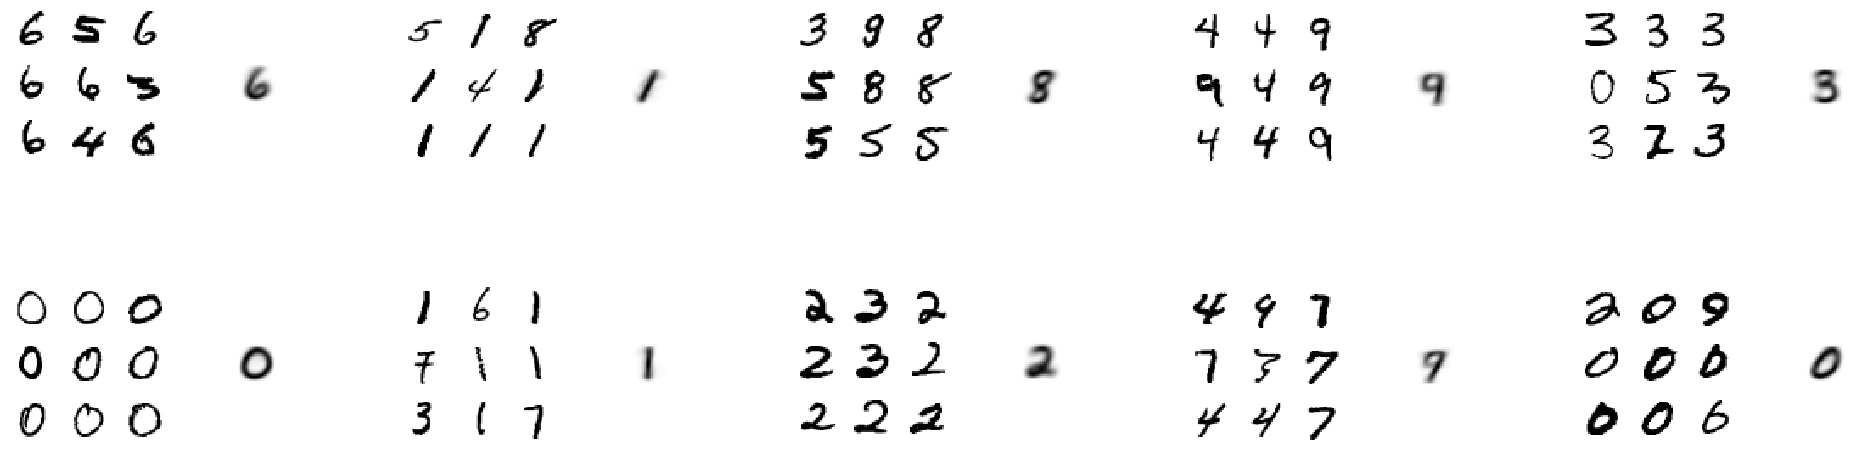
Inspecting the clusters, we see that they roughly correspond to the classes 6, 1, 8, 9, 3, 0, 1, 2, 9, 0. So, for example, instead of clustering digits belonging to the class 5, the algorithm rather distinguishes between two different kinds of 0's (thin round and thick crooked ones, it seems).
To analyse more rigorously which class fits best on which cluster, I will just try every of the 10! (= 3,628,800) possible permutations of class allocations. Note that I will validate the performance with the validation set and its labels. If you would really train this completely without labels you would try to find another way to see which cluster belongs to which digit.
from itertools import permutations
from multiprocessing import Pool


indices = []

for X in X_val:
    distances = np.array([euklidean_distance(X, centroid) for centroid in kmeans.cluster_centers_])
    indices.append(np.argmin(distances))


def validate(permutation):
    correct_predictions = 0
    for index, y in zip(indices, y_val):
        if y == permutation[index]:
            correct_predictions += 1
    return correct_predictions / len(y_val)


def search_for_best_permutation(permutations):
    best_permutation = None
    highest_accuracy = 0
    for index, p in enumerate(permutations):
        accuracy = validate(p)
        if accuracy > highest_accuracy:
            best_permutation = p
            highest_accuracy = accuracy
    return highest_accuracy, best_permutation


permutations = list(permutations(range(10)))

slices = np.array(range(17))*(int(len(permutations)/16))
p = []
for index, item in enumerate(slices):
    try:
        p += [permutations[item:slices[index+1]]]
    except:
        pass

with Pool(16) as pool:
    results = pool.map(search_for_best_permutation, p)

best_permutation = None
highest_accuracy = 0

for accuracy, permutation in results:
    if accuracy > highest_accuracy:
        best_permutation = permutation
        highest_accuracy = accuracy
We get the following best permutation:
Best permutation: (5, 1, 8, 4, 2, 3, 7, 6, 9, 0)
Accuracy: 0.5173
Obviously a model that only gets every second guess correct, is not very powerful. Of course there are ways to improve our results. I have chosen k-means because of its simplicity. Using more sophisticated algorithms for finding the centroids like expectation maximization or DBSCAN could lead to better results.
Now, let's see whether we can achieve better results by using the labels. For the supervised learning approach I will use the k-nearest neighbours algorithm. It is quite similar to k-means, but instead of assigning a class via the closest centroid, it finds the k nearest labeled samples in our 28x28 pixel image space (again using Euclidean distance). Based on the labels of the k nearest neighbours we decide which class a given test sample belongs to. Now that we are looking for very few but very similar images, the results should be much better than the comparison with the average images of each cluster.
Note: The parameter k determines how many training samples we use to decide to which class a test sample belongs. I would recommend using a k like 1, 3 or 5.
from sklearn.neighbors import KNeighborsClassifier
from sklearn.metrics import confusion_matrix


knn = KNeighborsClassifier(n_neighbors=3, n_jobs=64)
knn.fit(X_train, y_train)

y_pred = knn.predict(X_val)

sum([confusion_matrix(y_val, y_pred)[x][x] for x in range(10)])/confusion_matrix(y_val, y_pred).sum()
This outputs 0.9705.
With only 4 lines of code we we're able to generate and validate the model and get an accuracy of 97.05%.
How much data do we actually need?
Since not labeling the data didn't really work out, we will see if we can just reduce the amount of data, so that we don't need to spend so much time labeling.
For this I'm going to use the very powerful and easy-to-use XGBoost classifier. I will train it with different amounts of data to find out how the amount of training data affects the performance.
At the same time I will assuring that the classifier gets enough time to learn as much as it can with the data in each turn: I will let the classifier run until it didn't improve for 100 epochs.
If you like, have a look at the code, or skip it to check out the results.
import os
import xgboost as xgb
seed = 42
np.random.seed(seed=seed)def generate_path():
path = 'results/'
tries = list(filter(lambda folder : 'try' in folder, os.listdir(path)))
next_try = max([int(t[3:]) for t in tries]) + 1
path += f'try{str(next_try)}'
os.mkdir(path)
return pathdef training(number_of_training_samples=len(X_train)):
training_data = xgb.DMatrix(data=X_train[:number_of_training_samples],
label=y_train[:number_of_training_samples])
validation_data = xgb.DMatrix(data=X_val,
label=y_val)
parameters = [("eta", 0.08),
("max_depth", 10),
("subsample", 0.8),
("colsample_bytree", 0.8),
("objective", "multi:softmax"),
("eval_metric", "merror"),
("alpha", 8),
("lambda", 2),
("num_class", 10)]
num_boost_round = 10000
early_stopping_rounds = 100
evals = [(training_data, 'train'), (validation_data, 'validation')]
boost = xgb.train(params=parameters,
dtrain=training_data,
num_boost_round=num_boost_round,
evals=evals,
early_stopping_rounds=early_stopping_rounds,
verbose_eval=False)
y_pred = boost.predict(validation_data)
score = sum([prediction == label for prediction, label in zip(y_pred, y_val)]) / len(y_val)
number_of_iterations = boost.best_iteration
return score, number_of_iterationsdef evaluate(numbers_of_samples: list) -> pd.DataFrame:
path = generate_path()
categories = ['Number of labeled samples',
'Number of iterations',
'Accuracy']
results = pd.DataFrame([], columns=categories)
for samples in tqdm_notebook(numbers_of_samples):
print(f'Number of samples: {samples}')
np.random.seed(seed=seed)
accuracy, number_of_iterations = training(number_of_training_samples=samples)
results_of_this_run = pd.Series([samples, number_of_iterations, accuracy], index=categories)
results = results.append(results_of_this_run, ignore_index=True)
results.to_csv(f'{path}/results.csv')
return resultsnumber_of_samples = [60000,50000,30000,10000,6000,1000,600,100]
results = evaluate(number_of_samples)This is what we get:
Number of labeled samples |
Number of iterations |
Number of iterations |
60,000 |
343 |
0.9734 |
50,000 |
450 |
0.9724 |
30,000 |
469 |
0.9656 |
10,000 |
309 |
0.9449 |
6,000 |
247 |
0.9287 |
1,000 |
197 |
0.8400 |
600 |
392 |
0.8080 |
100 |
323 |
0.3488 |
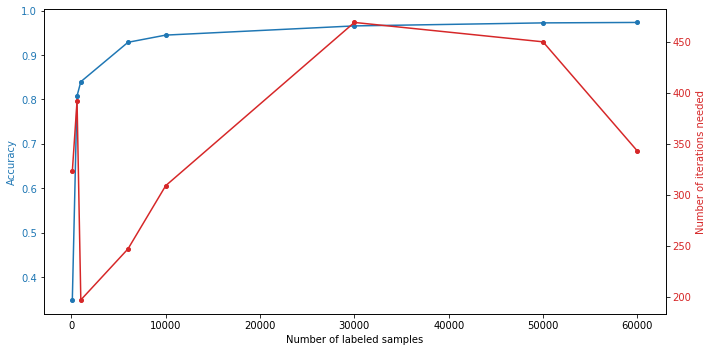
As we can see, getting good results over 80% can already be achieved with less than 1% of the maximal amount of training images and over 90% with just 10%. Still, the more images, the higher the obtained accuracy.
Conclusion
We showed that you can sometimes emulate supervised learning with unsupervised and just rely on unlabeled data. However, the results were much worse than with labeled data.
When it comes to the amount of training data we have seen that for classifying handwritten digits you don't need 60,000 images. Above a certain sample size there are probably better things to do with your time than labeling, e.g. hyperparameter tuning. But having more data is always good and the number of images you need heavily relies on the problem. If you have a problem that disturbs you from successfully realizing your machine learning project, you can book our free Machine Learning Expert Talk.
Contact
If you would like to speak with us about this topic, please reach out and we will schedule an introductory meeting right away.