
Popular methods of Explainable AI (XAI)

There are many reasons to introduce an explainability component to your ML project (see more here), but there are even more ways to go about it.
This post is the second one in the dida’s XAI-series and in it we will be looking at the differing ontologies that can be found across the XAI literature to try and give an overview of the most popular explainability methods.
The question of how exactly machine learning models, especially as big as LLMs, know how to perform so well on tasks they were never trained to solve, remains an open one in the ML research community. This is where the explainability research community steps in to try and take a peek inside the black box.
Ontologies
Even outside of the ML domain, the first step to explaining anything is asking questions. The first question to ask could be to ourselves: ”What do we know about a given model?” When you’ve trained your first NN with one or two hidden layers on the MNIST dataset, and want to find out why “1” is often confused with “7”. Looking at the train and test datasets could be enough explanation: The model might have seen more examples of one rather than the other, or the examples in the train dataset only contain very similar depictions of the two numbers. On the other hand, if you trained a basic Perceptron NN, then you probably know all of the maths behind your project, and can justifiably argue that you know exactly how the model works. As the authors of a famous SHAP method state in their paper : ”The best explanation of a simple model is the model itself”. These examples demonstrate one way to separate the explainability methods: into data representation and data processing approaches.
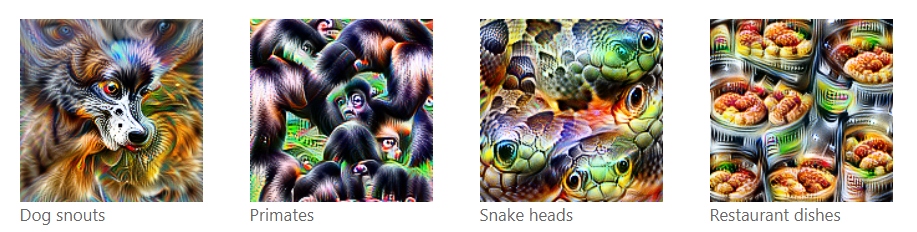
I can’t help but mention one very intriguing method that belongs to the data processing explanation group, the “Feature Visualization” project. Olah et al. found ways to generate inputs that maximized the activation in distinct layers’ neurons in an InceptionV1 network and thus showed what the model “understands” as a dog, for example. Below you can see a screenshot from the project’s website.
What I have described until now leans toward the area of research that deals with understanding AI in general, however these explanations would unlikely satisfy an industry client or someone without the necessary knowledge base. One user category for which this holds especially are medical doctors: They need explanations to receive assistance that is insightful rather than assertive and to enable the patient's informed consent for the AI processing of their data (which won’t be informed unless they know how the model works).
Another sensible question to ask oneself when deciding for one or the other explainability technique would be: ”What would we like to explain?”. If the answer is: ”We would like to explain the inner workings of the model”, one should search for a global explanation method, and if motivation behind specific model outputs is more interesting to our use case, a local explanation method would be more fitting. The ”Feature Visualization” project described above is a global explanation method, as it tries to explain how separate parts of a network perceive the world.
There are many concrete ways to implement explanations, but the research community has agreed on the usefulness of saliency mapping and counterfactual explanations. They are easily comprehensible methods that work in a similar fashion and can be best understood on the example of an image classification model. A salience map method would output something similar to a heatmap of the model’s attention, highlighting the areas that were most important for the model’s decision. Counterfactual explanations also work towards finding the most important parts of an input, but do so by finding minimal parts of it, that, were they to be even slightly changed, would result in a different model decision. Think of a model that can identify birds: A bullfinch would no longer be a bullfinch if it didn't have a red tummy. But then look at a chaffinch, who is also red-breasted, but has a blue crown on its head. The focus of a salience map explanation for deciding in favor of a bullfinch would be on the red tummy and the bird’s black head (and on the snowy background or rowan berries if you aren’t very careful with your train data). A counterfactual explanation will also focus on these areas, but the model will motivate its decision by visualizing the changed input image with the bullfinch’s head color turned blue to indicate that this is the minimum perturbation needed to change its decision towards chaffinch. These two methods belong to the local explanation group.

Not all models are the same when it comes to explainability: some are inherently more interpretable, when their structure allows to directly inspect how input features contribute to the output (like linear regression or shallow decision trees), some less – often due to their complexity and non-linear feature interactions (DNN’s, SVM’s).
When the model’s complexity does not allow for applying existing explainability methods to it or when the model was not developed with an in-built explainability feature, surrogate (also often called proxy) models can be inferred from them to imitate the original model’s behavior and simultaneously allow for a degree of explainability, providing insights of the original model’s focus. Many saliency methods are surrogate methods.
Methods
Now that the classification base of the methods has been covered, we can review some of the methods with respect to it.
LIME
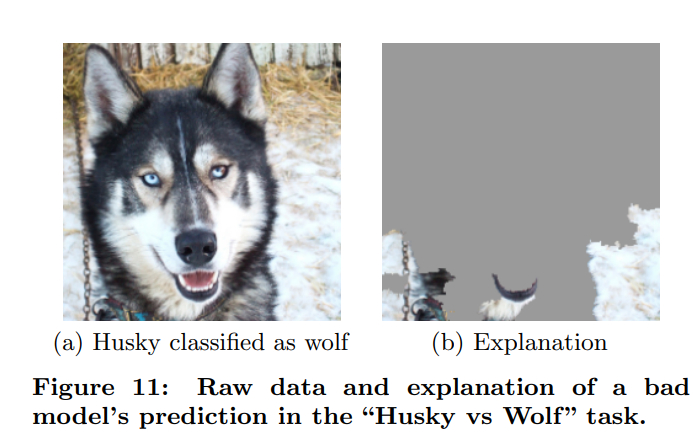
One of the most famous explainability techniques is Local Interpretable Model-Agnostic Explanations that takes a black-box system and an instance of interest as an input, and explains the former by probing behavior on perturbations of a chosen input. The resulting data is used to construct (train, essentially) a local model that is the proxy for the original model in the neighborhood of the chosen input. In other words, the output model simulates the behavior of the original one, but is a simpler version of it so that its feature importance attribution can be collected more easily. This way you can not only identify areas of the input that are most influential for the decision but also apply it to different problem domains and different ML models. A case study was conducted in the same paper that introduced LIME to demonstrate this method in action. Ribeiro et. al used LIME to explain a biased classifier that frequently confused huskies with wolves. What they found out is that the most influential area of input for the model’s decision “wolf” was the snowy background.
By its nature, LIME is a local, surrogate data processing method. However, there is already work that builds on top of LIME and proposes a global k-LIME method, where a clustering algorithm is applied to the black box model to find k clusters and learn a generalized linear model for each of them in order to mimic the predictions of a model it explains.
LRP
Layer-Wise Relevance Propagation is a feature attribution method that belongs to the saliency method group of local explanations. The goal of this method is to quantify the contribution of each individual feature to the prediction. It is suitable for various input modalities such as images, videos, and text. LRP propagates the prediction f(x) — for example, a generated word or token — backward through the neural network using specially developed propagation rules, which can be adapted depending on the layer type.
AttnLRP
An extension of LRP, AttnLRP, is able to do the aforementioned with transformer models, all the while minimizing the computational cost.
A model that uses AttnLRP could distribute its attention the following way:

AttntLRP would assign very high relevance to the “not” particle, since the negation often changes the whole semantics of the sentence. “Bullfinch” is of high importance, because it's the entity of interest, and the verb contributes moderately. LRP methods not only work with user queries, but can also be used to ground the model answer in its knowledge base, providing the user with sources where the information was extracted from.
SHAP
SHapley Additive exPlanations act similarly to both LRP and LIME, but use the game-theoretic approach to reach the overarching goal. In fact, the paper that introduces SHAP begins with showing how LRP, LIME and Classic Shapley Values use the same explanation model (aka any interpretable approximation of the original model) called “Additive feature attribution method”. Quantifying each feature’s attribution to the output thus seems to be a very insightful explanation that can be implemented in a plethora of ways.
The difference of SHAP from the former methods lies in the way feature attributions are estimated: Shapley values (the underlying game-theoretic concept) are determined by considering each feature a player in a payout-maximizing game and measuring each player’s individual contribution to the prediction. The values are calculated by considering all possible player combinations – coalitions – and the outcome they would achieve together.
SHAP takes this approach and proposes a method to approximate these values, since considering all feature combinations in an ML model can be computationally very expensive (downright impossible).
It is a model-agnostic local method, which means it can explain all sorts of models, even transformers.
CounTEX
The Counterfactual explanation with TEXt-driven concepts method is way less known than LIME or LRP, but we wanted to give a concrete example from the counterfactual explanation family, and this one is interesting because the authors trained an algorithm to use natural language to back up the visual explanation. This feature aids to explain what part of the highlighted area in the counterfactual explanation was important, whether it was the pattern or the color that was important for the decision. This can be helpful in cases when the counterfactual explanation is located in a very small area of the input image and a human cannot exactly tell what is being shown to them as an explanation.
Conclusion
Explainability is an important part of ML research, as it works towards building a knowledge base on top of which user trust can be built and that can promote the adoption of algorithmic decision making even in the more sensitive areas of work. There has not yet been established an industry standard for explainability, but this only means that everyone can choose a method category that best suits their needs.
This text presents some important explainability methods with respect to how these methods can be classified. By introducing different categories, it aims to give an overview of research directions in the field of explainability and gives concrete examples for each category.